Investigate threats using the Entity Workflow
The Entity Workflow is the primary method for investigating and resolving threats in Corelight Investigator. It transforms threat hunting by shifting focus from individual, disconnected alerts to compromised network devices known as Entities (hosts or domains). By grouping related detections around specific devices, you can prioritize work based on actual network risk rather than alert volume, and follow a structured path from initial detection to final resolution.
Note
If Agentic Triage is enabled for your tenant, an AI Insights column also appears in the Highest-risk Entities panel, showing the AI confidence verdict for each analyzed entity. See Investigate threats using Agentic Triage for guidance on using AI Insights.
Why use the Entity Workflow
Reduced Alert Fatigue: Related detections are automatically grouped into incidents centered around a single Entity (IP address or domain), allowing you to see the full attack story instantly instead of manually connecting disconnected alerts.
Faster Triage: Prioritize your workspace using the Highest-risk Entities panel and use interactive heatmaps to filter the entire dashboard by severity or MITRE tactic with a single click.
Structured Information Hierarchy: Follow a logical investigative flow that moves from high-level impact scores down to device identity, threat context, granular forensic evidence, and raw network logs.
Integrated Investigation and Response: Pivot directly to external reputation tools like VirusTotal or Shodan, and use integrated EDR tools like CrowdStrike, Microsoft Defender, or Palo Alto to take response actions without leaving Investigator.
Operational Speed: Use Bulk Actions to resolve or assign hundreds of alerts simultaneously, a major accelerator for clearing your daily priority queue.
Workflow summary
The Entity Workflow organizes your investigation into six stages, moving you from initial alert detection to final threat resolution. Investigator operates on a 24-hour analysis cycle to prioritize what you see on the dashboard. Depending on the specific threat, you can follow the complete path or use shortcuts to resolve it quickly.
Prioritize your work: Identify high-risk entities using the Highest-risk Entities panel to focus on actual network danger rather than alert volume.
Assess a threat before investigating: Use dashboard shortcuts like the Entity Summary Card for an initial check to decide if an entity requires a deeper investigation.
Investigate an Entity: Use the Entity Overview to confirm a device’s identity, its role on your network, and critical attack milestones.
Analyze traffic patterns and context: Audit the Detections Activity timeline and data table to identify when an attack started and gather forensic evidence.
Close alerts and contain the threat: Resolve threats using Bulk Actions to close groups of alerts or integrated EDR tools to isolate compromised hosts.
Finalize and reset the Queue: Close open detections to clear the entity from your active queue and reset its risk score for the next 24-hour cycle.
Prioritize your work
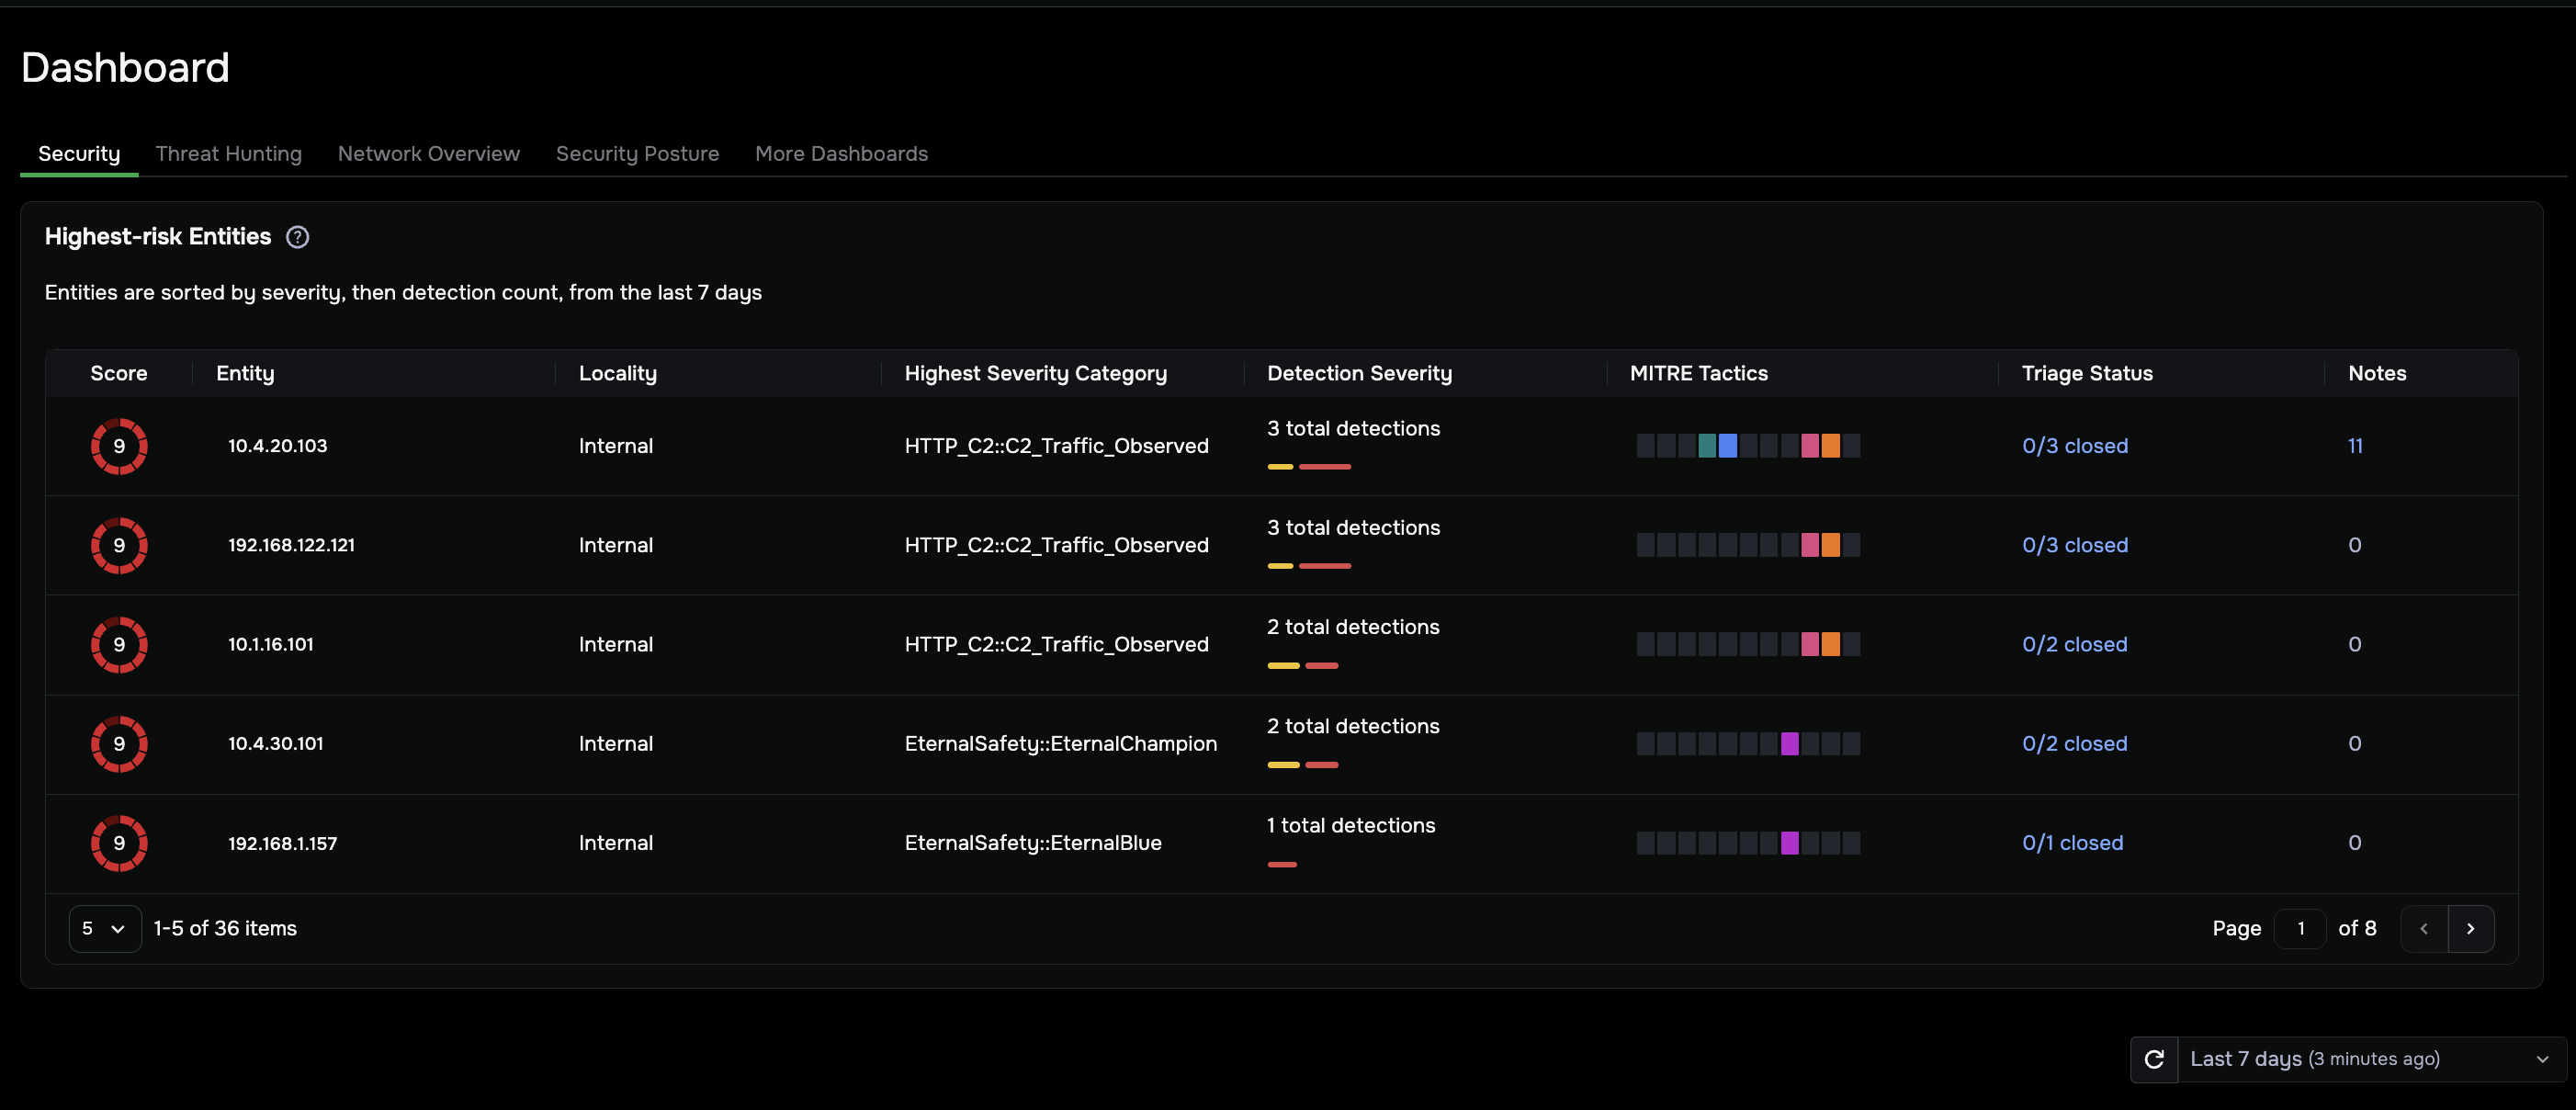
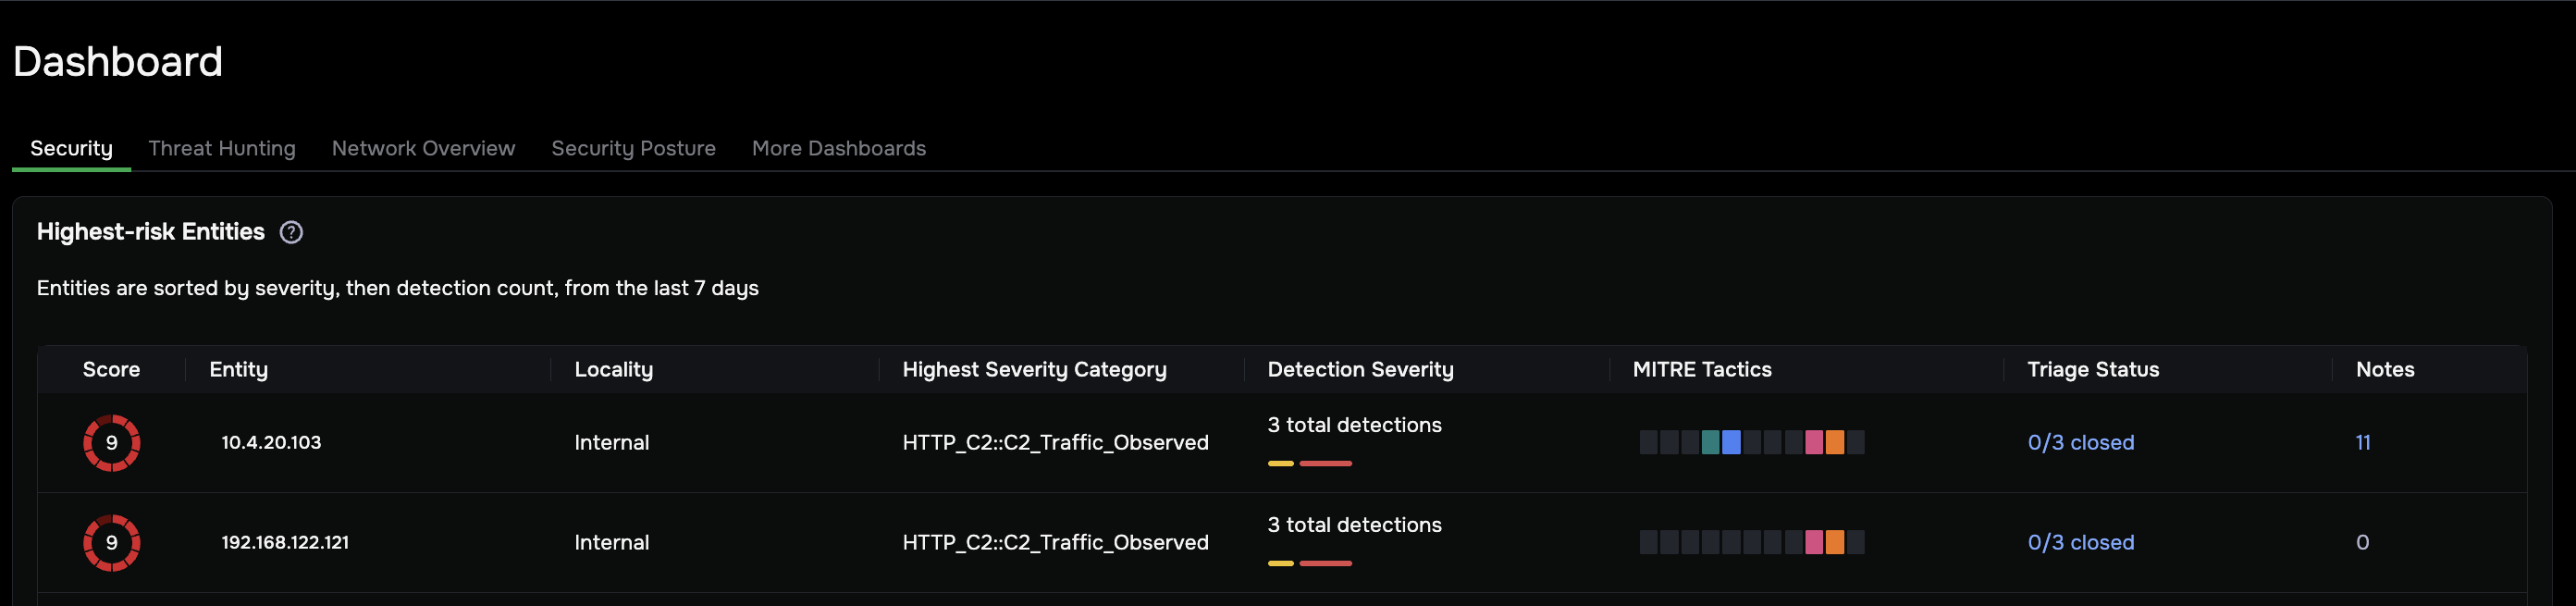
The Highest-risk Entities panel on the Dashboard | Security tab is your primary starting point. This list ranks devices based on suspicious activity from the last 7 days, automatically sorted by Score first, then by total detection count.
The Detection Severity column, further to the right, shows color bars representing the breakdown of detection severity levels for that entity — giving you a visual sense of what’s driving the Score. Use the Score to prioritize which entity to investigate first, and the Detection Severity bars to quickly assess the mix of threats behind it.
The goal at this stage is to identify which entity to focus on first, based on actual network risk rather than alert volume.
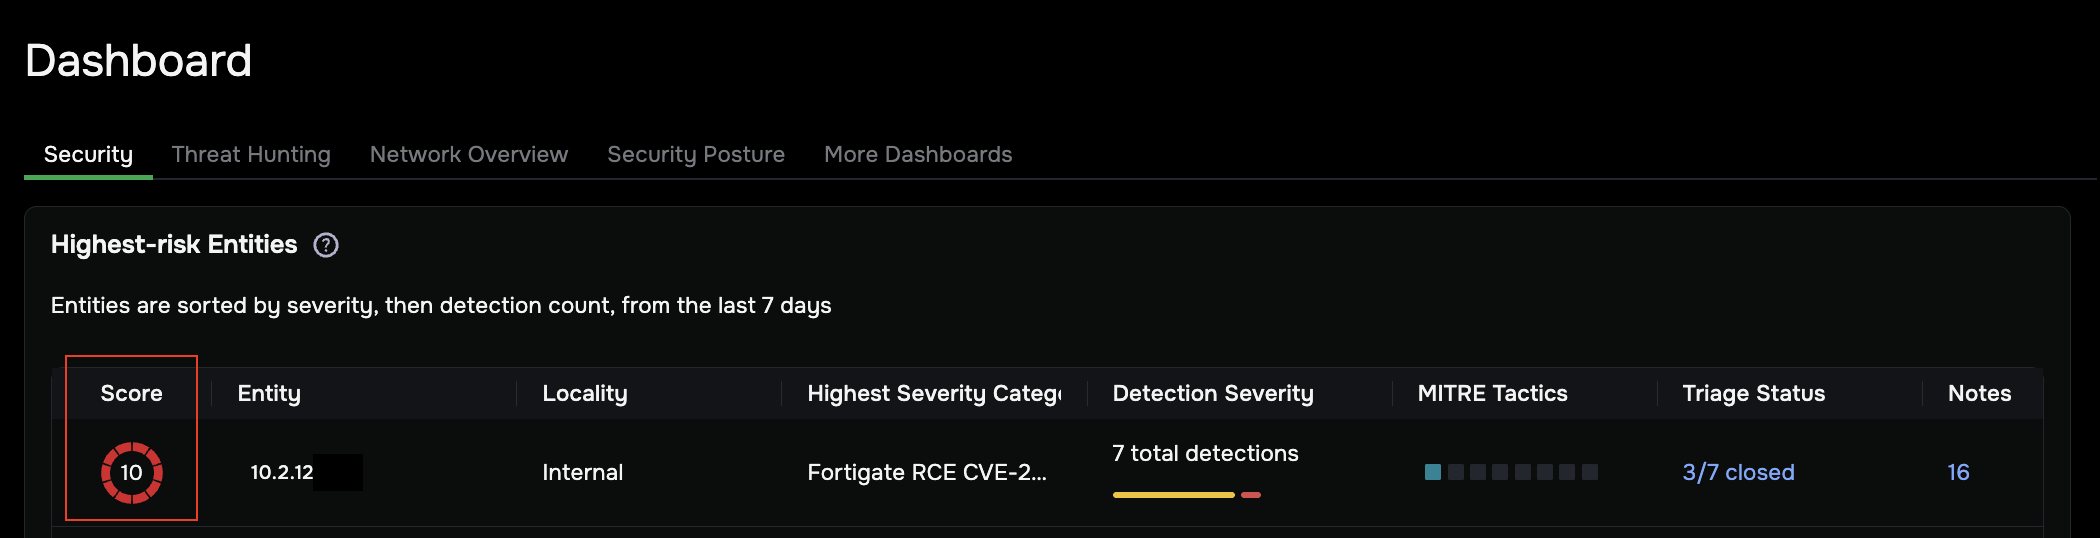
Interpret the Score
The Score column (far left) assigns each entity a risk value from 1–10, based on the highest severity detection triggered during the last 7 days.
Score |
Severity |
What it means |
|---|---|---|
9–10 |
Critical |
High-risk threats such as ransomware or active C2 communication |
7–8 |
High |
Suspicious activity requiring immediate attention |
1–6 |
Medium / Low |
Minor policy violations or unusual but lower-risk activity |
Use interactive filters
The Highest-risk Entities table is interactive. You can click elements directly to narrow the list without leaving the dashboard:
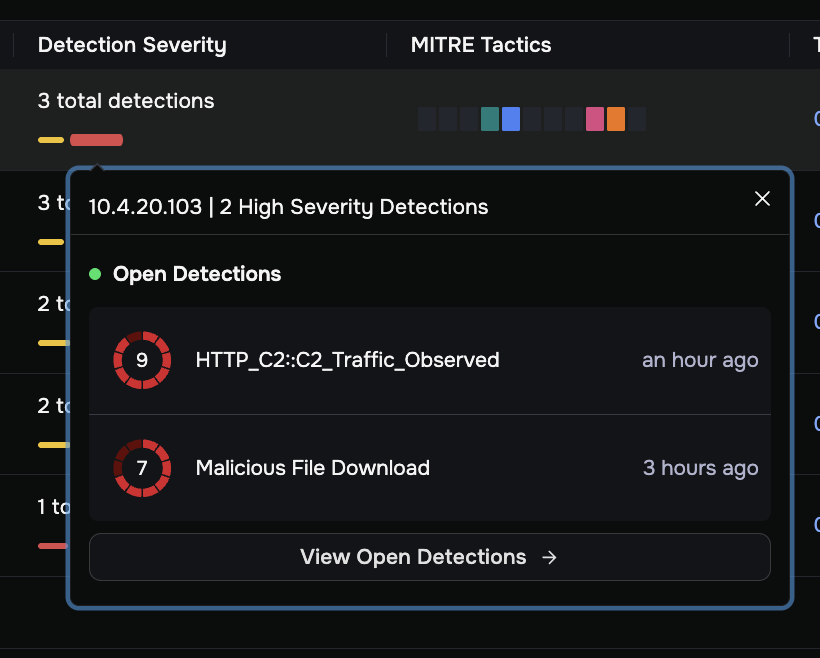
Detection Severity: Click a color bar to open a popover showing the open detections that match that severity level for the entity. Click View Open Detections → at the bottom of the popover to navigate directly to a filtered detections list.
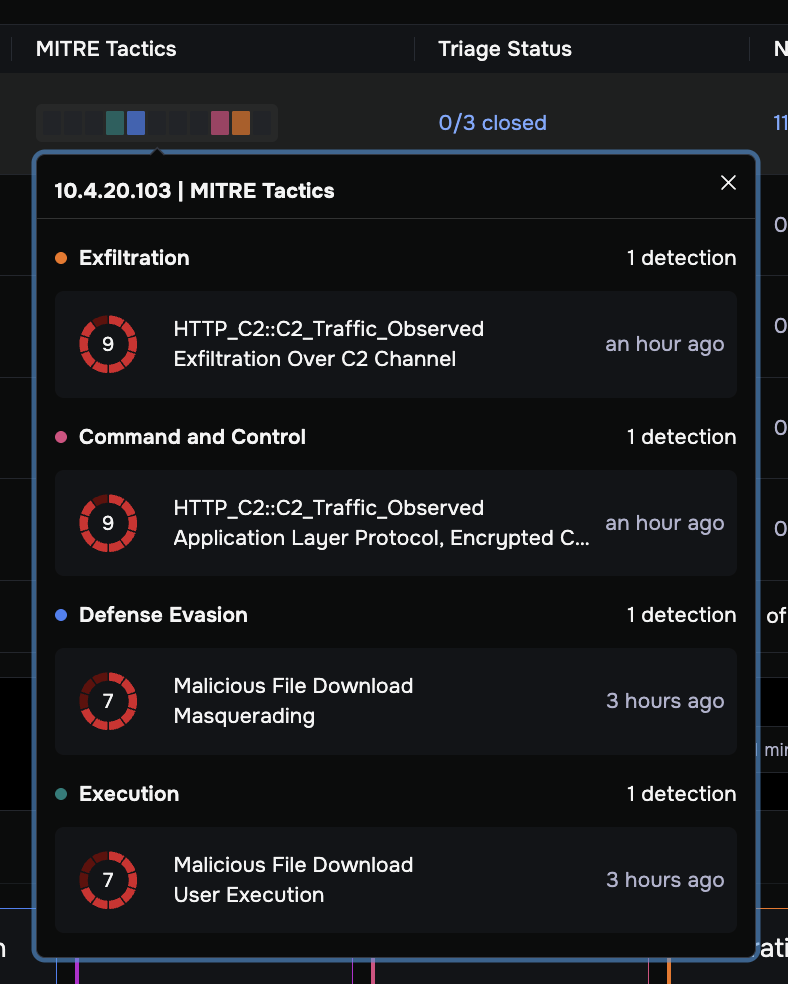
MITRE Tactics: Click a tactic block (such as Command and Control or Lateral Movement) to see only the entities involved in that specific stage of an attack.
Triage Status: Click the triage status value (such as “0/5 closed”) to see the current open and closed detection breakdown for that entity.
Notes: The number in the Notes column shows how many analyst comments have been added to detections for that entity. Click it to read existing notes or add your own.
Refresh the Dashboard
The dashboard does not update automatically while you are viewing it. To load the latest data:
Click the refresh button (circular arrow icon) in the lower-right corner of the panel, or
Reload the page in your browser.
The “Last 7 days (X minutes ago)” indicator in the lower right shows when the data was last loaded.
Assess a threat before investigating
Before committing to a full investigation, use these dashboard shortcuts to validate a threat and decide if it requires a deep dive without leaving the main dashboard.
Validate threats with the Entity Summary Card
How to use it: Hover your mouse over an IP address or domain in the Entity column.
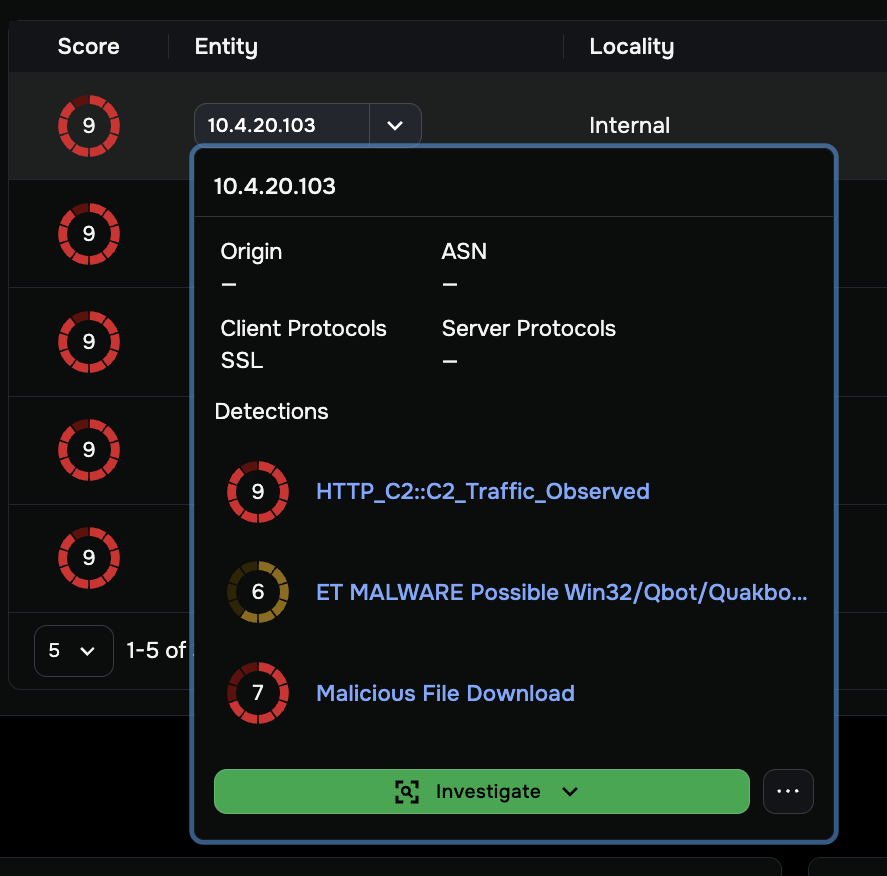
The Entity Summary Card gives you a rapid first assessment of an entity:
Verify Identity: Check Origin, ASN, and Client / Server Protocols to determine if the device is a known asset or an unknown external threat.
Spot Patterns: Review the recent detections listed at the bottom of the card to identify recurring malicious behavior and individual risk scores.
Take Quick Action: Click the three dots (…) to access:
Suppress Entity: Mutes all future alerts for this device. Use this only for confirmed safe devices such as authorized vulnerability scanners. This option may be unavailable (grayed out) if the entity has active open detections that have not yet been reviewed.
Copy Value: Copies the IP address to your clipboard for use in external research tools.
View all detections: Click View All → to open a filtered detections list for this entity.
Start a deep-dive investigation: Click the green Investigate button to open the full Entity Overview.
Pivot to investigative evidence with the Entity Context Menu
How to use it: Click the dropdown arrow (▼) next to any IP address or domain in the Entity column.
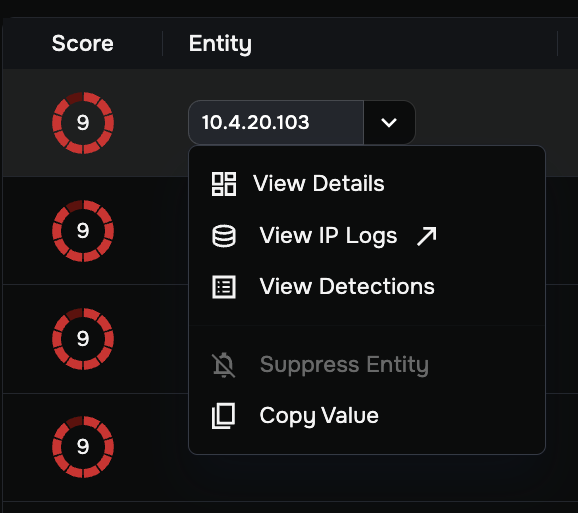
Use this menu to quickly access specific data for an entity:
View Details: Opens the full Entity Overview for an in-depth investigation.
View IP Logs: Navigates directly to LogSearch and runs a pre-filtered query showing all network traffic for this IP address.
View Detections: Opens a filtered list of every individual alert for this device.
Suppress Entity: Mutes future alerts for this device. This option is grayed out if the entity still has active open detections pending review.
Copy Value: Copies the IP address to your clipboard for use in tools such as VirusTotal or Shodan.
Investigate an Entity
The Highest-risk Entities panel is your starting point for opening an entity investigation.
To open the Entity Overview, click any of the following in the Highest-risk Entities panel, or use the Entity Summary Card:
Number in the Score column
IP address in the Entity column
Internal or External in the Locality column
Entry in the Highest Severity Category column
The green Investigate button in the Entity Summary Card (hover any entity to open it)
The Entity Overview opens, consolidating device identity, threat context, and forensic evidence in a single view.
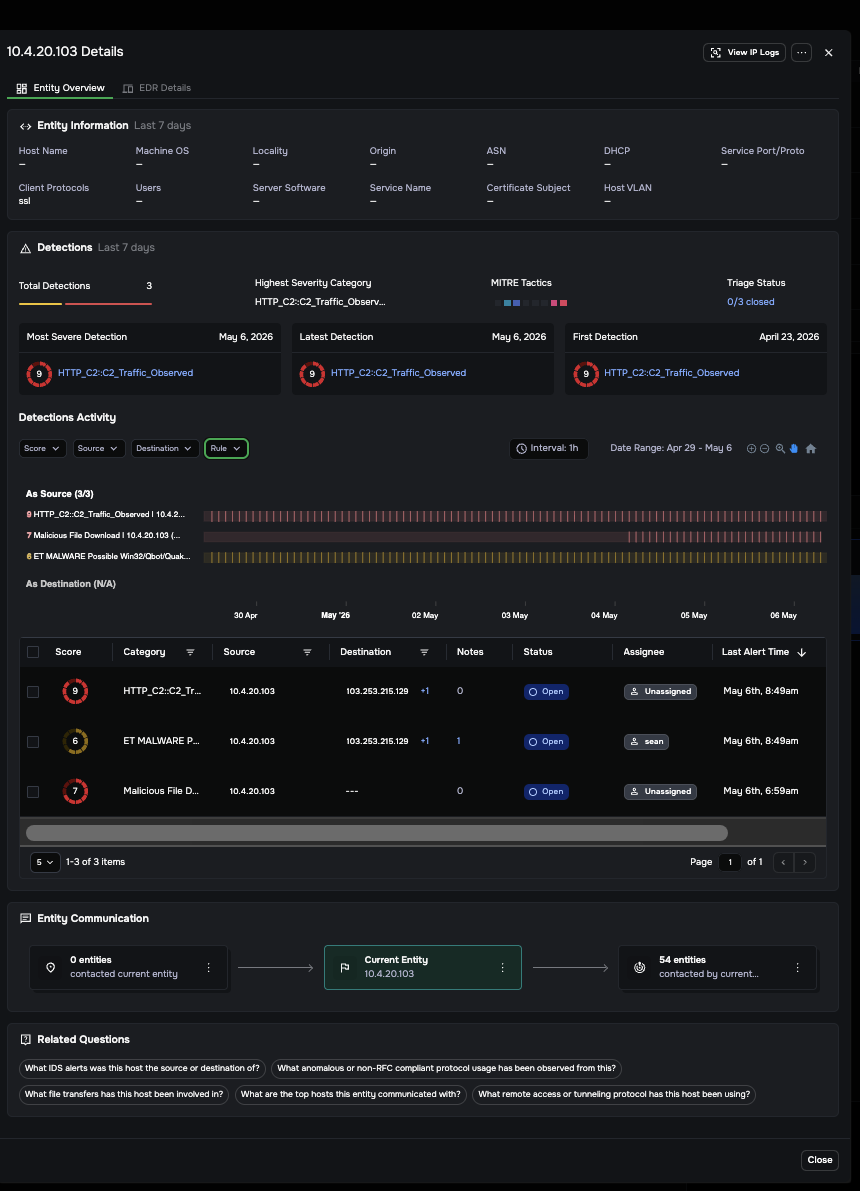
The Entity Overview moves you through three questions in sequence: what is this device, why does it matter, and what’s the proof.
Note
Two actions are always available in the Entity Overview header, regardless of which tab or section you are viewing: View IP Logs (executes a pre-filled LogSearch query for all network connections involving this IP) and the three-dot menu (…) (provides access to Suppress Entity, View Detections, and Copy Value). Use these at any point during your investigation without losing your place.
If Agentic Triage is enabled, the Entity Overview also includes additional panels, including the Analysis Summary, Investigation Findings, and Recommended Responses. See Investigate threats using Agentic Triage for guidance.
Pivot to raw evidence using View IP Logs
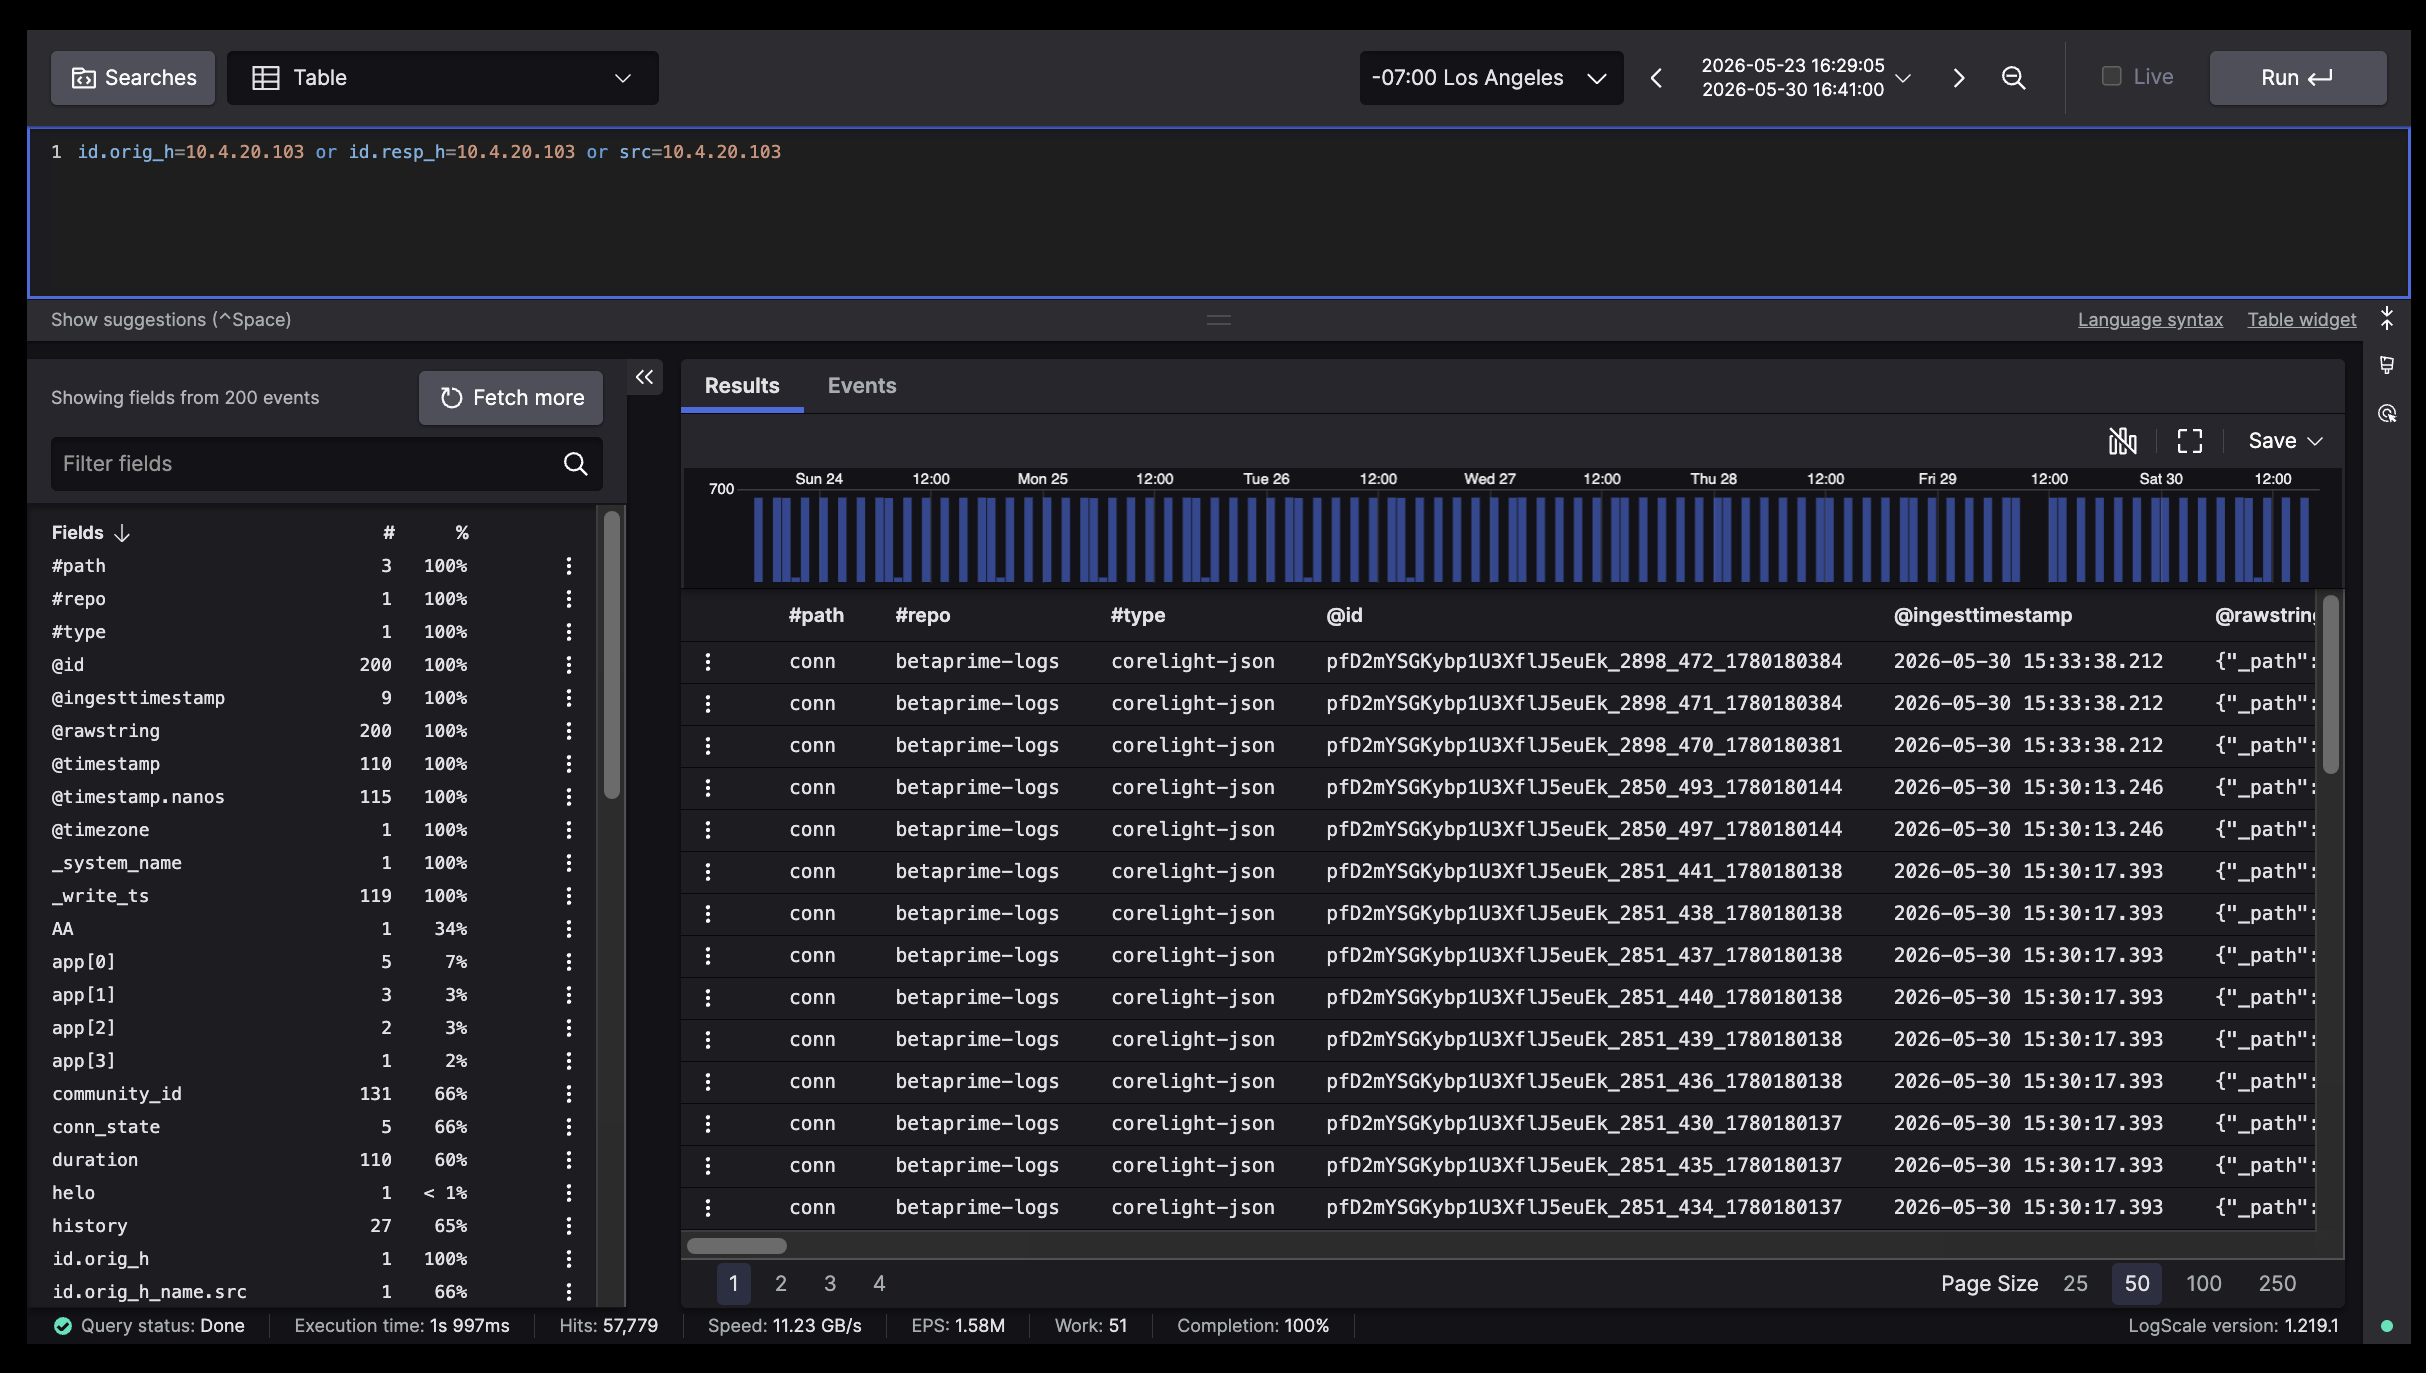
The View IP Logs button in the Entity Overview header executes a pre-filled LogSearch query for every network connection involving this IP. Use it at any point during your investigation to pivot from the Entity Overview directly into raw Zeek and Suricata logs — no manual query writing required.
LogSearch opens with the query pre-populated and results loaded automatically. From there you can filter by field, drill into individual log records, and verify the raw network data behind any detection or AI finding.
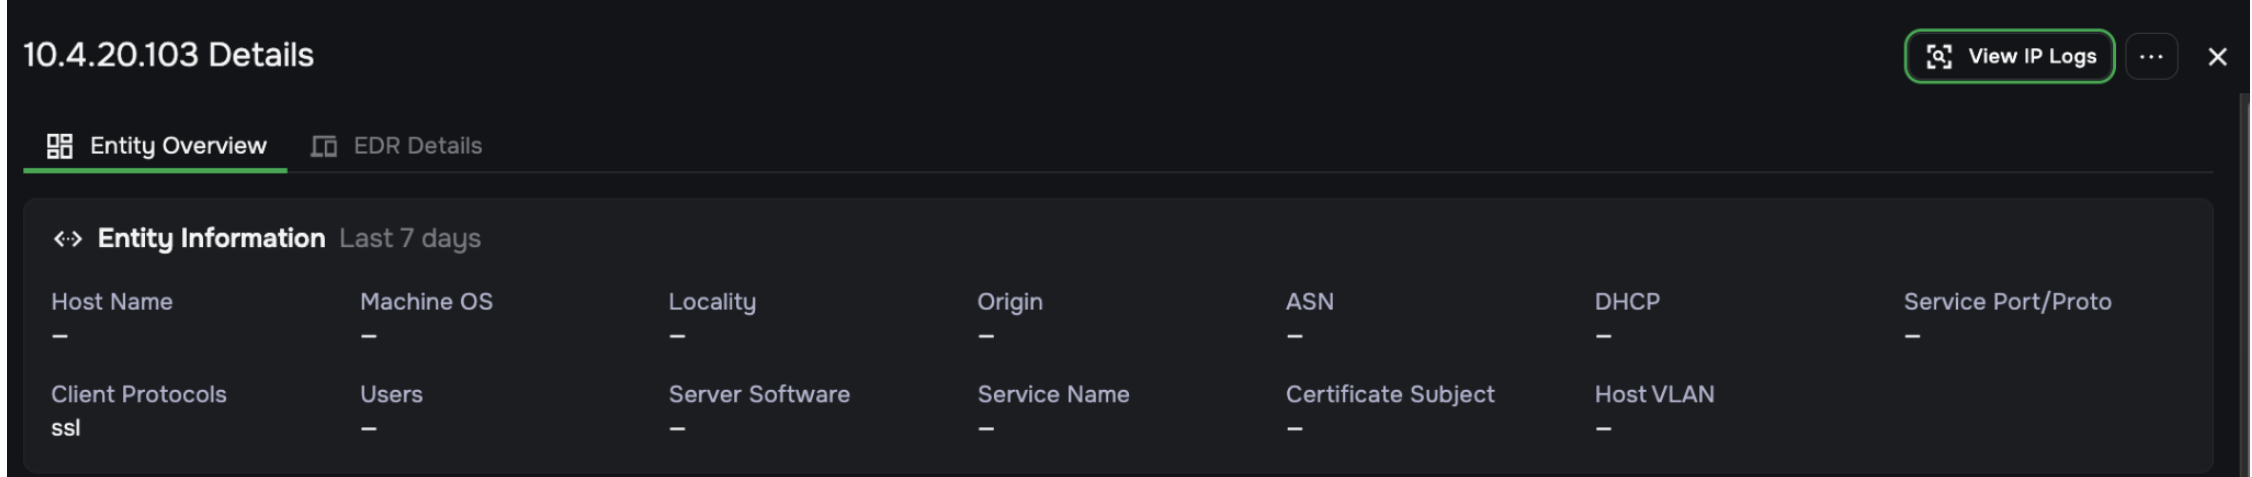
Identify the device using Entity Information
The Entity Information panel helps you confirm what this device is and what role it plays on your network.
How to use it: Review the following fields to build a picture of the entity:
Field |
What it tells you |
|---|---|
Host Name |
The device’s network name, if available |
Machine OS |
The operating system, if detected |
Locality |
Whether the device is Internal or External |
Origin |
Geographic origin of the IP |
ASN |
Autonomous System Number that identifies the owning organization |
DHCP |
DHCP lease data if available |
Service Port/Proto |
Ports and protocols this device is serving |
Client Protocols |
Protocols observed in outbound traffic |
Users |
User accounts associated with this device |
Server Software |
Software identified as running on this host |
Service Name |
Named services observed |
Certificate Subject |
TLS certificate subject, useful for identifying servers |
Host VLAN |
Network segment this device belongs to |
Note
The richness of this panel depends on how Corelight sensors are deployed in your environment, how traffic feeds are filtered, and whether an EDR integration is configured. When an EDR integration like CrowdStrike or Microsoft Defender is active, you will typically see the Host Name, Machine OS, and user data populated. Without an EDR integration, many fields may appear as dashes (—). This is expected behavior, not an error.
Assess the threat scope using Detections
The Detections panel shows you how serious the threat is and which stages of an attack are involved.
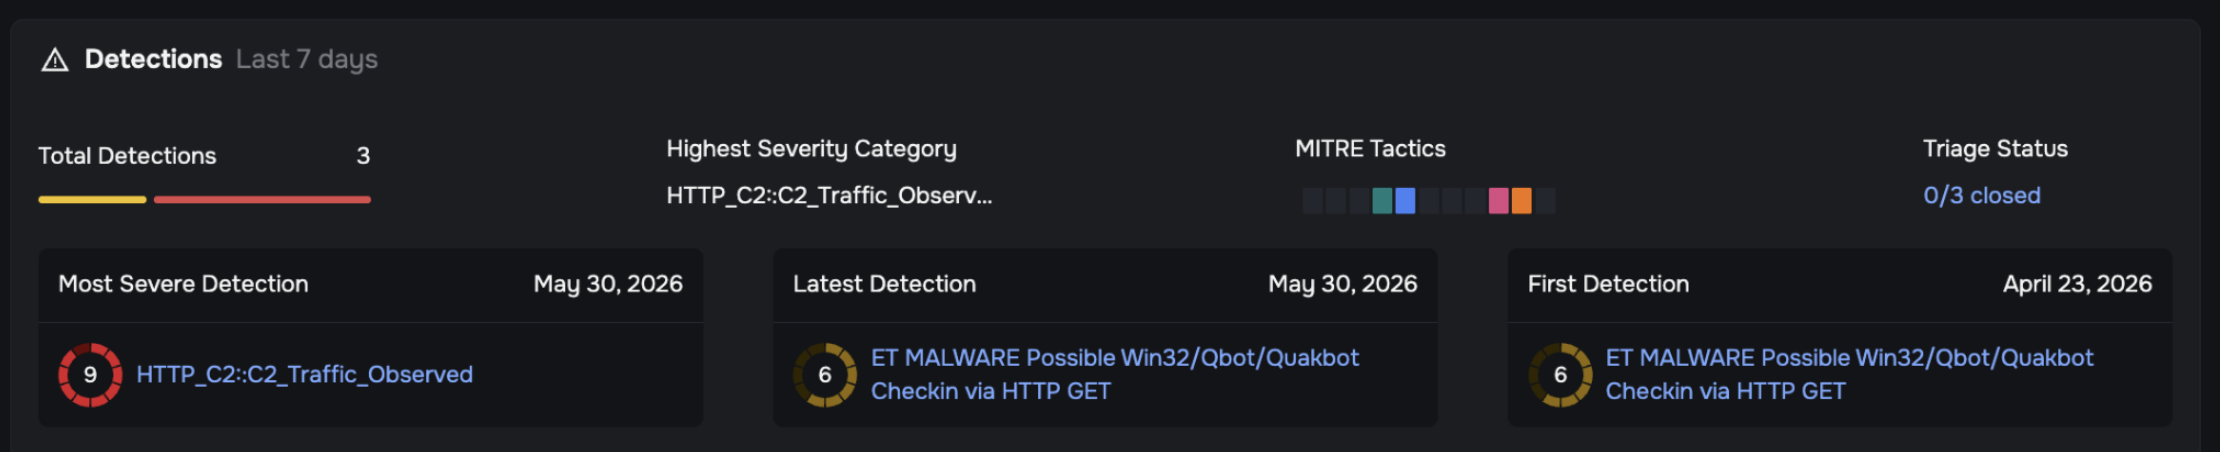
This panel provides a compact, high-density summary of all detections for this entity over the last 7 days. Every element in this panel is interactive.
Detection summary row:
Total Detections: The count of all detection instances for this entity. Click the colored severity bar below the count to filter the view by severity.
Highest Severity Category: The name of the highest-severity detection rule triggered by this entity.
MITRE Tactics: Color-coded blocks representing the MITRE ATT&CK tactics observed. Click any tactic block to filter the Detections Activity section to show only detections related to that attack stage.
Triage Status: Shows how many detections have been closed (e.g., “0/5 closed”). Click to see a breakdown of open vs. closed detections.
Attack timeline:
Milestone |
What it tells you |
|---|---|
First Detection |
The earliest suspicious activity and potential initial entry point |
Most Severe Detection |
The point of peak risk during the attack lifecycle |
Latest Detection |
The most recent activity, used to determine if the attack is still ongoing |
Click any detection name in the timeline to open a slide-out with details about that specific detection rule.
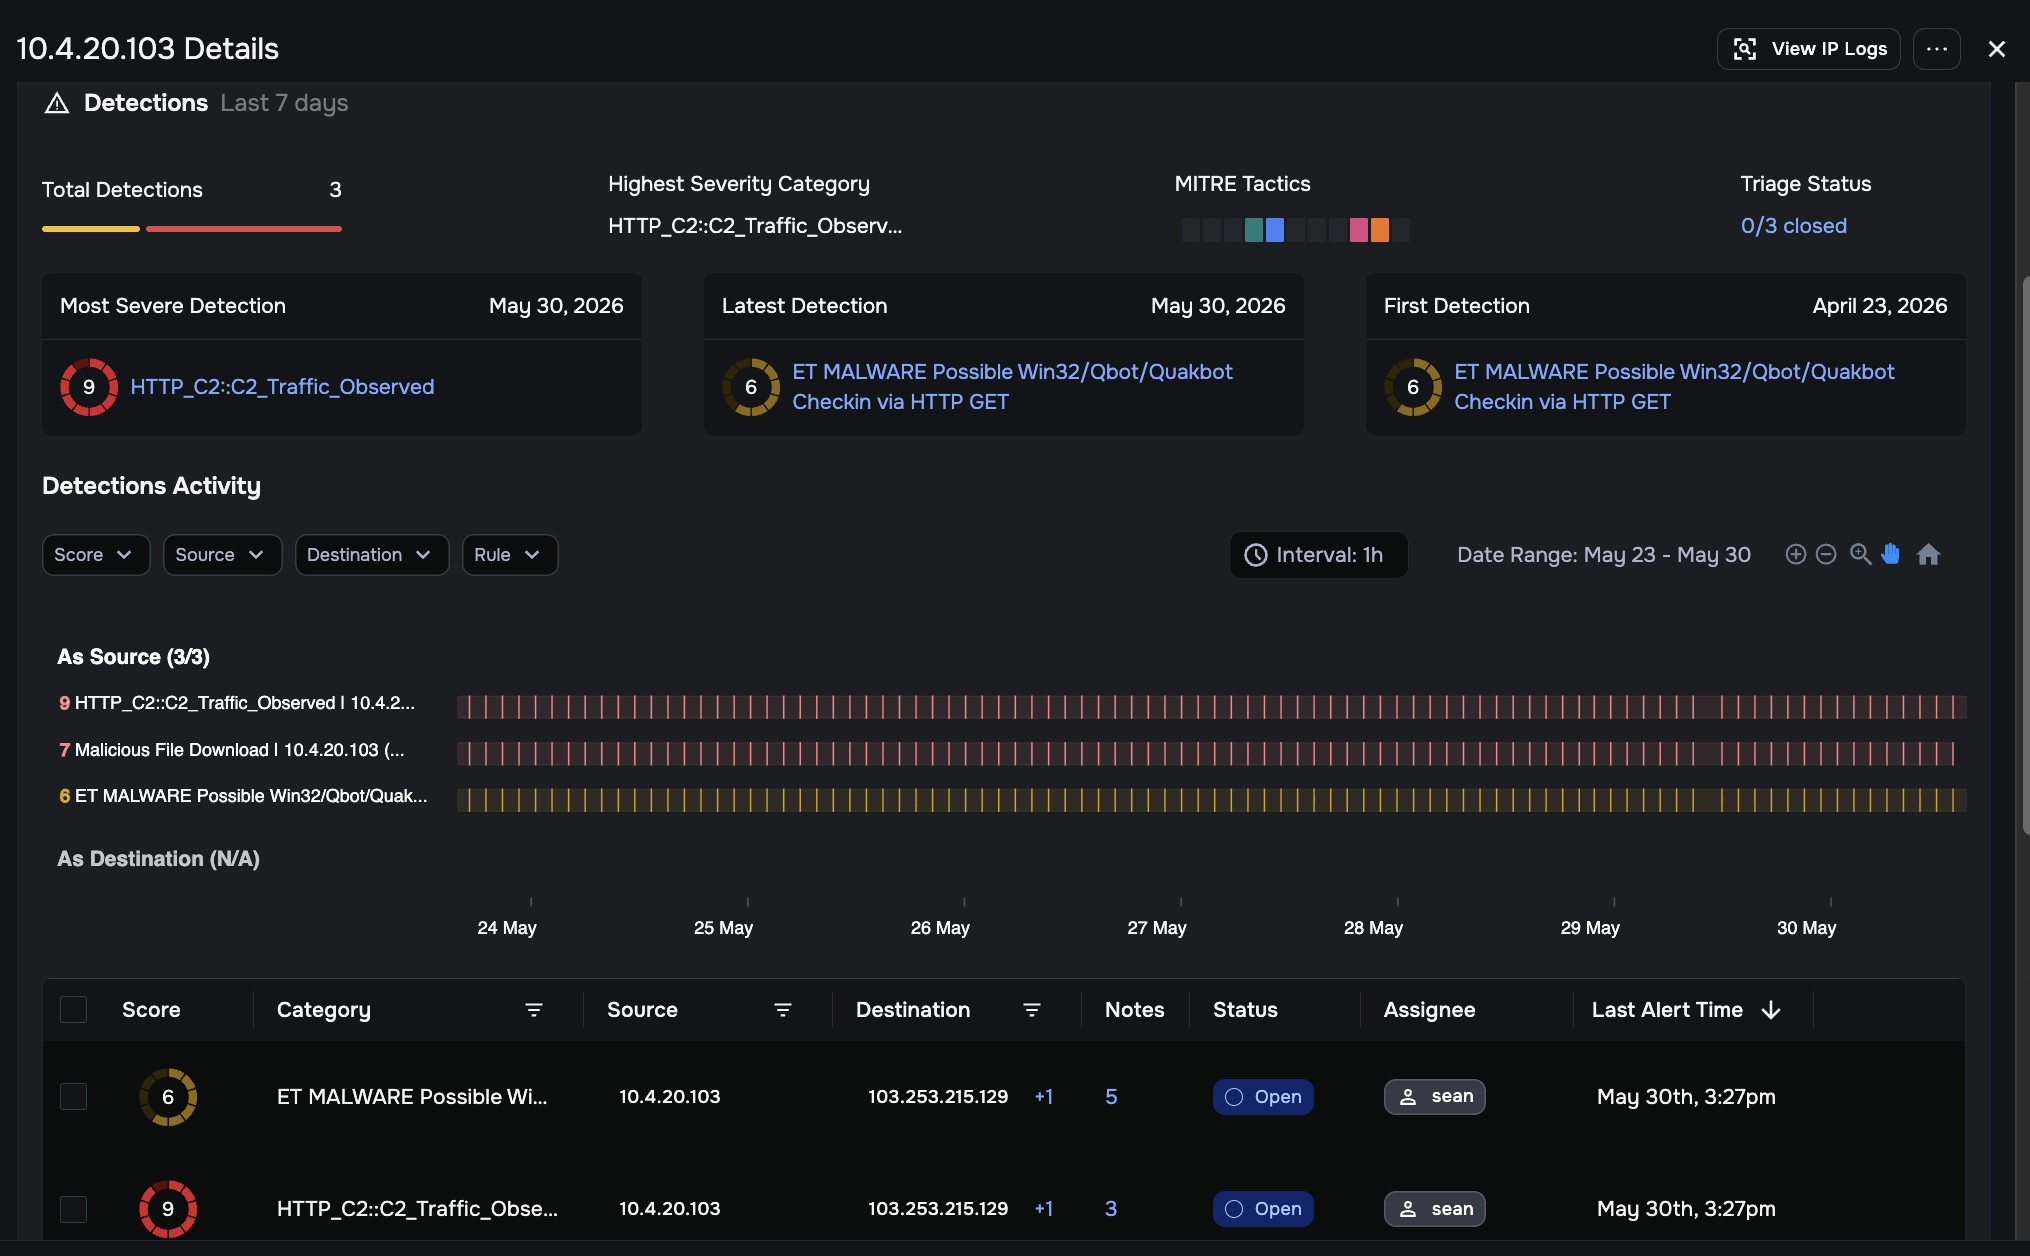
Gather evidence using Detections Activity
The Detections Activity section is where you find forensic evidence to confirm or rule out a compromise. It combines a visual timeline with a detailed data table.
Identify activity Spikes
The timeline visualizes alert volume over time at an hourly interval, allowing you to see exactly when suspicious behavior occurred.
Spot Spikes: Look for vertical bars that are significantly taller than surrounding bars; these represent bursts of suspicious activity.
Understand the layout: Detections are grouped into two sections:
As Source: Detections where this entity initiated the suspicious activity.
As Destination: Detections where this entity was the target. In most entity investigations, this section will show N/A, as the entity under investigation is typically the source.
Filter the view: Use the Score, Source, Destination, and Rule dropdown menus above the timeline to narrow both the timeline and the data table simultaneously. When reviewing the As Destination grouping, a Source filter is also available to narrow results by the originating IP address, useful when an entity has a high number of inbound detections from multiple sources.
Drill down by time: Hover your mouse over any bar in the timeline to see the specific detection names and counts triggered during that hour.
Navigate and zoom: Use the timeline controls in the upper right (+, −, magnifier, pan, and home icons) to zoom into specific time ranges or reset the view to the default date range.
Audit the Detections Table
The table below the timeline provides granular details for every individual alert instance. The table defaults to sorting by Last Alert Time (descending), most recent first. You can change the sort by clicking any sortable column header.
Key interactions in the table:
Expand Destination Groups (+N): When a single detection has triggered against multiple destination IPs, those addresses are combined into one row and grouped with a +1, +5, or similar indicator. Click this indicator to expand the full list of destination IPs.
Important
Do not overlook grouped destinations. A single row showing +5 means the entity communicated with 6 different external addresses under the same detection rule. Each address may represent a separate C2 server, exfiltration target, or lateral movement hop. Always expand grouped rows before assessing the scope of an attack.
Hover over a Destination IP: Hovering over any destination IP address in the Destination column opens a hover card showing that IP’s Origin, ASN, Client/Server Protocols, and its own recent detections. This lets you quickly assess the reputation of an external address without leaving the view.
Check External Reputation: For public-facing destination IPs, click the VirusTotal, Shodan, or Censys icons that appear on the row. Each opens a new browser tab pre-filtered for that IP address on the respective third-party intelligence site. No installation or account is required.
Note
These icons only appear on rows with public (external) IP addresses. They will not appear for internal IPs, which is expected behavior.
Understand Rule Significance: Click the detection name in the Category column to open a slide-out panel explaining what the specific detection rule looks for and why it matters.
Inspect Raw Logs: Click the View in LogSearch icon on any row to pivot directly to the raw Zeek or Suricata network logs that triggered that detection.
Check the Notes column: A number in the Notes column indicates how many analyst comments have been added to that detection. Click it to read existing notes or add your own.
View alert details: Click View Alert Details (green eye icon) in the Actions column, or click anywhere on a row to highlight it and open the Alert Details panel on the right. The panel shows Alert Name, Timestamp, UID, Source IP, Destination IP, and Type, followed by Connection Details and protocol-specific sections (DNS, HTTP, SSL, File). Click See More on any section to view the full raw Zeek log for that log type.
Analyze traffic patterns and context
After reviewing the Detections Activity, use the following panels to build a broader picture of the entity’s network behavior.
Review traffic flows using Entity Communication
The Entity Communication diagram provides a directional map of how the entity is interacting with your network, showing both inbound and outbound connections.
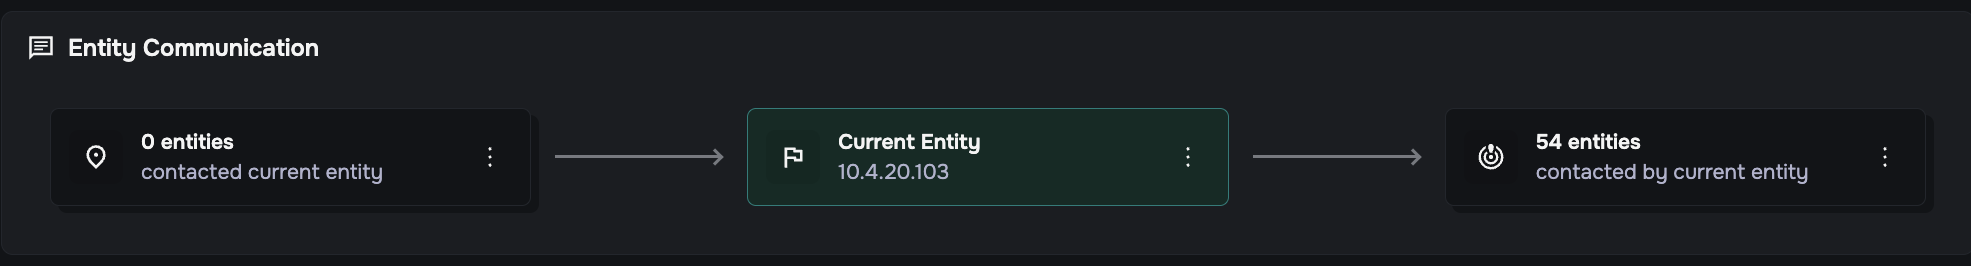
Analyze traffic direction:
Left box (entities contacting this host): Shows how many external or internal entities initiated connections to the current entity (inbound). An unusually high inbound count on an internal workstation may indicate it is acting as a server or has been targeted.
Right box (entities this host contacted): Shows how many entities this host reached out to (outbound). A high outbound count (sometimes called “fan-out”) may indicate lateral movement, data exfiltration, or C2 beaconing behavior.
Pivot to raw logs: Click the three-dot menu (…) inside any of the connection boxes to access View in LogSearch for that specific traffic direction. This runs a pre-filtered query showing only the raw connection logs for those flows.
Run pre-built investigative queries using Related Questions
The Related Questions panel at the bottom of the Entity Overview provides one-click investigative shortcuts. These are pre-built LogSearch queries that automatically run for the current entity with no manual query writing required. For example, you might see questions such as “What IDS alerts was this host the source or destination of?” or “What file transfers has this host been involved in?”
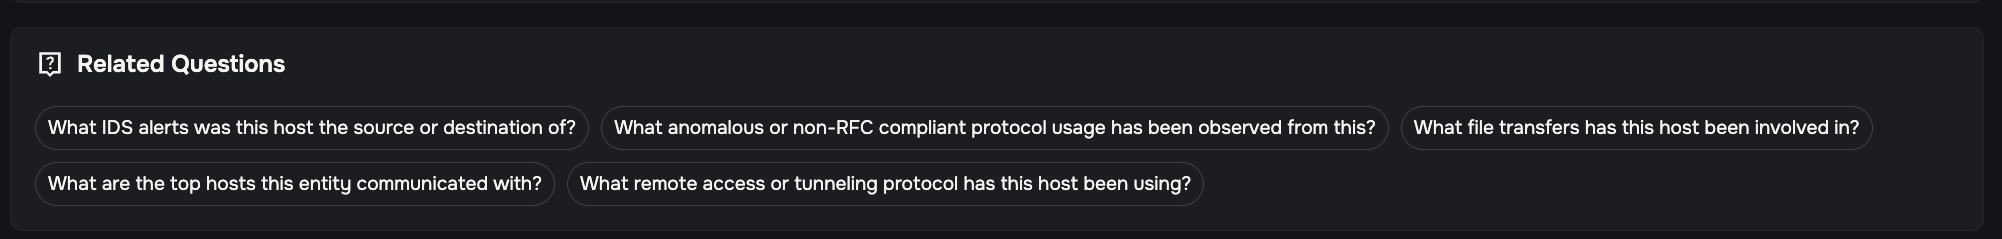
Click any question to immediately execute the query in LogSearch, pre-filtered for this entity’s IP address.
Close alerts and contain the threat
You can take action in two places: the Detections Activity table for managing alerts, and the EDR Details tab for containing compromised hosts.
Use Bulk Actions to manage alerts
Bulk Actions is one of the most powerful features in the Entity Workflow. Before manually closing or assigning detections one at a time, use this feature to handle all of them at once.
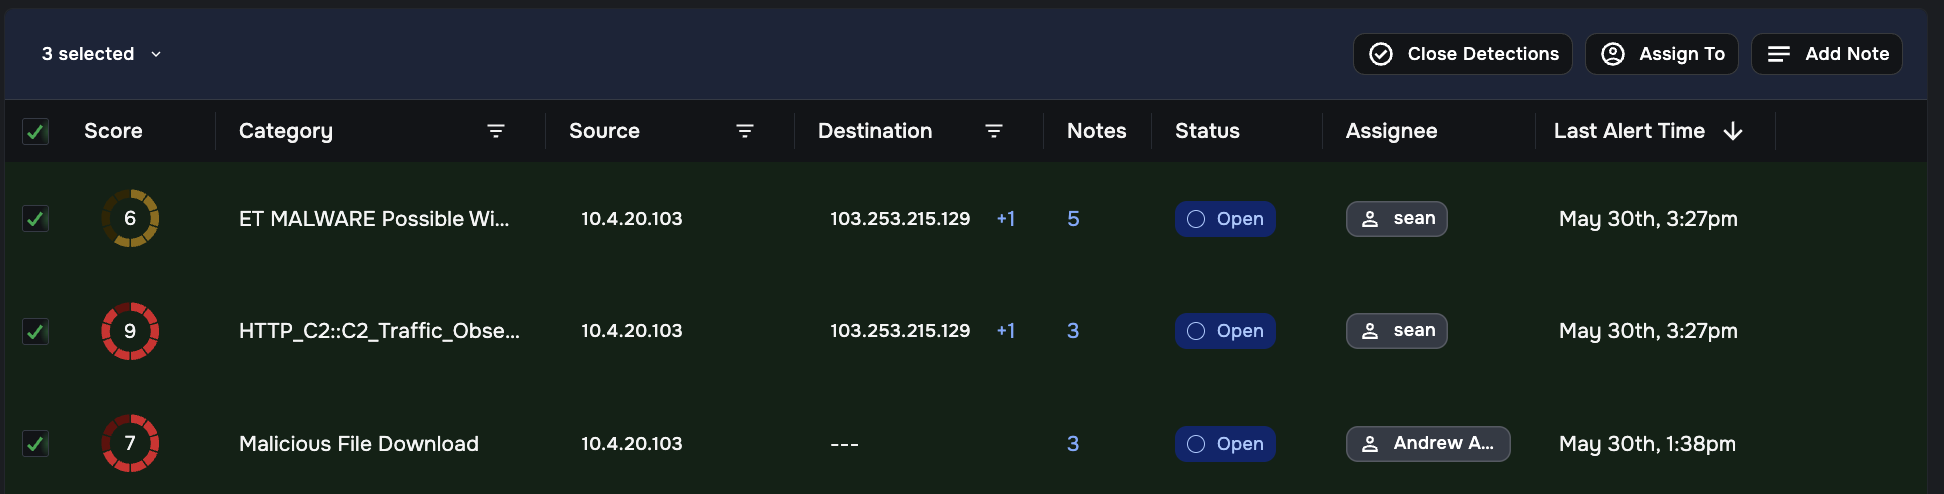
From the Detections Activity table, Bulk Actions allow you to apply changes to many alerts in a single step:
To use Bulk Actions:
Select alerts using one of these methods:
Check individual boxes next to specific detections, or
Click the Select All checkbox in the column header to select everything currently visible in the table (use the filters first to narrow the set if needed).
The number of selected detections appears above the table (e.g., “5 selected”).
Choose an action from the bulk action bar that appears:
Close Detections: Marks all selected detections as resolved. Use this when you have confirmed the detections are handled, either investigated and cleared or confirmed as false positives. Closing all detections for an entity removes it from your active priority queue.
Assign To: Opens a searchable list of users on your team. Select a user to transfer ownership of all selected detections to that analyst.
Add Note: Opens a text dialog where you can write a comment that will be attached to all selected detections simultaneously. Use this to document your findings, reasoning, or next steps for the group.
Tip
Use the Score, Source, Destination, or Rule filters above the timeline to narrow the detection table to a specific subset (for example, all false-positive alerts from a known scanner), then use Select All and Close Detections to resolve the entire group in one action.
Contain the threat with EDR
Click the EDR Details tab at the top of the Entity Overview to access your integrated endpoint security tools. This tab is available regardless of whether Agentic Triage is enabled.
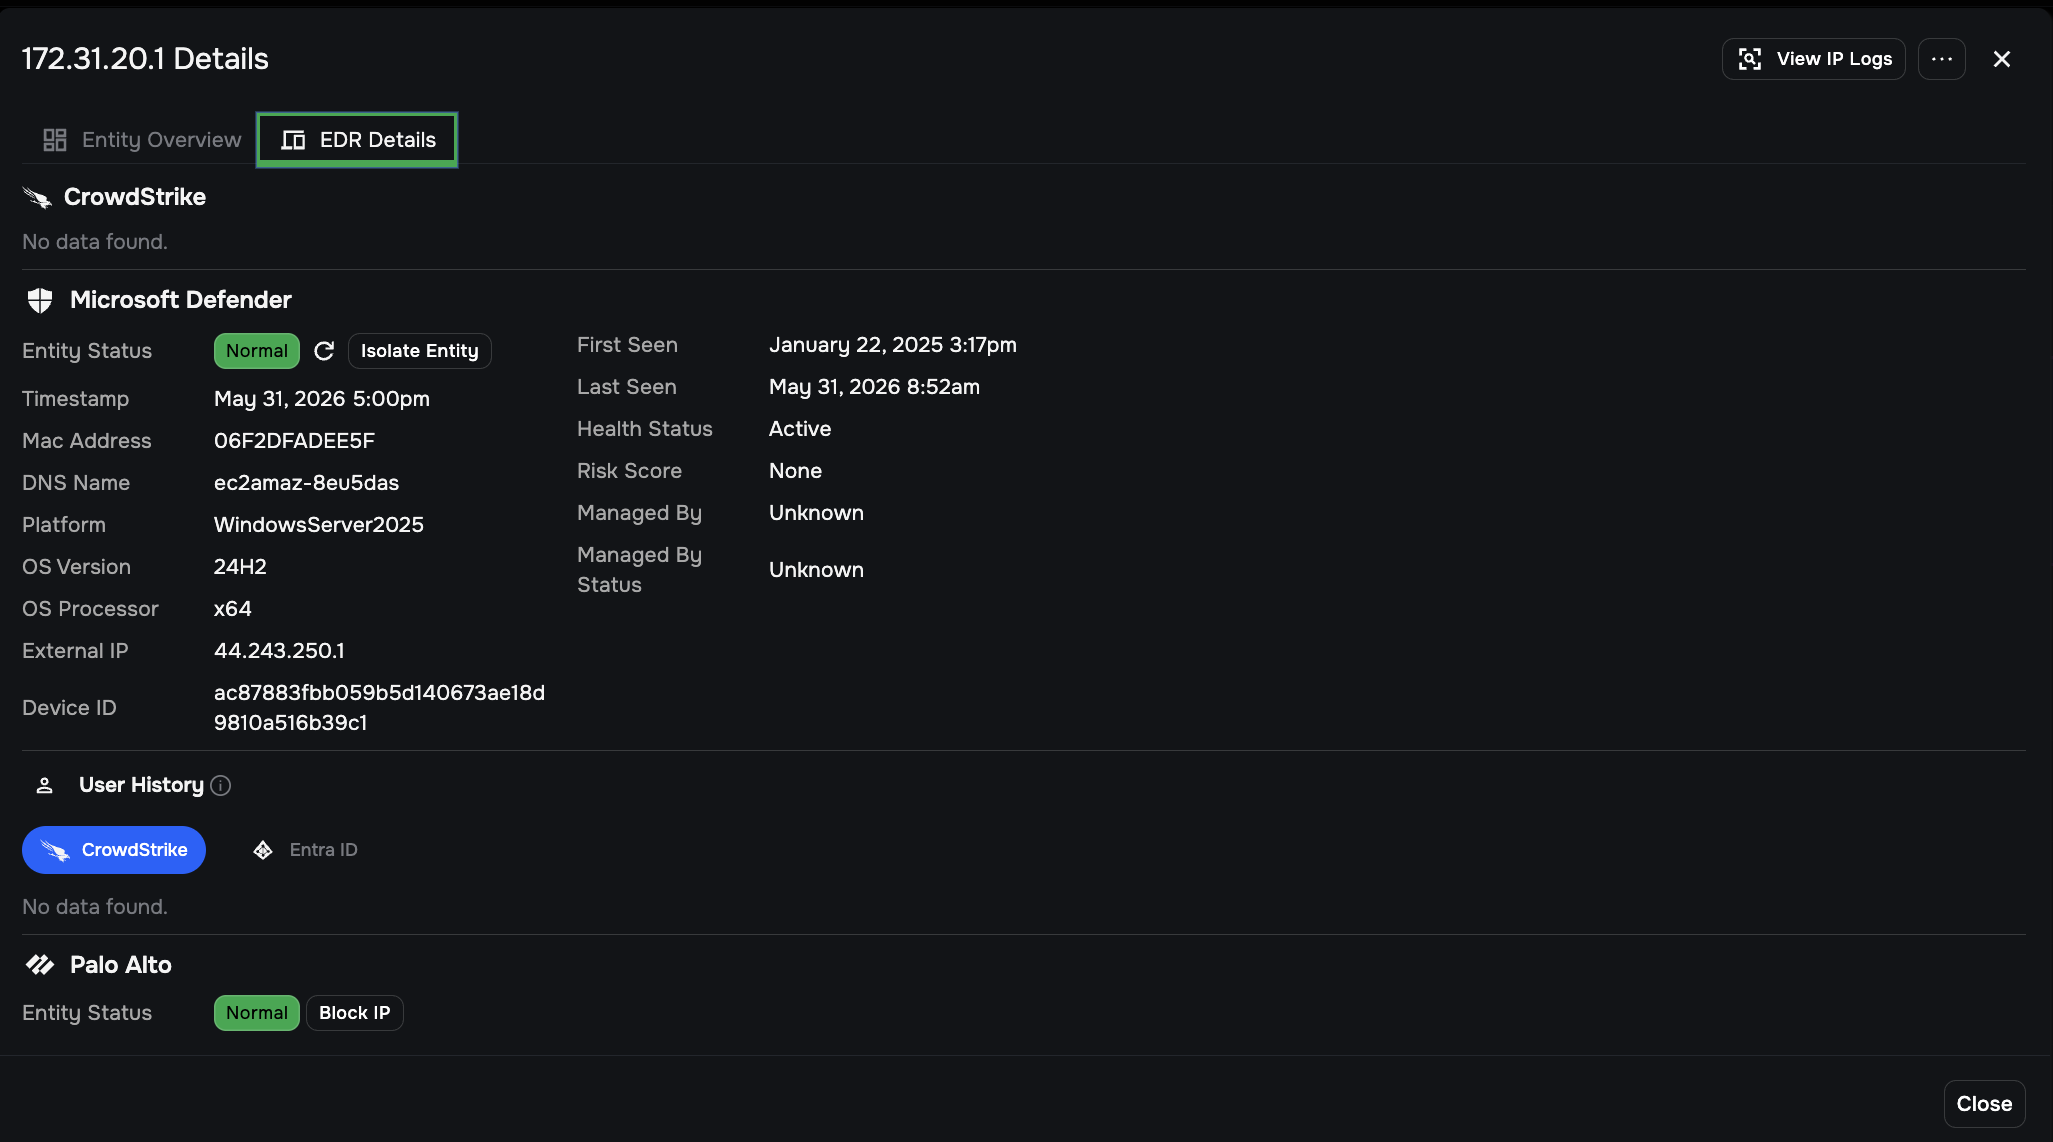
Sections appear based on which integrations are enabled for your environment. If an integration is enabled but has no data for this entity, the section displays “No data found” — this is expected and means the integration has no data for this specific entity, not that the feature is broken.
CrowdStrike
When a CrowdStrike Falcon agent is present on the entity:
View detailed asset information including Host Name, Mac Address, DNS Name, Platform, OS Version, OS Processor, External IP, and Device ID.
View First Seen and Last Seen timestamps, Health Status, Risk Score, and Managed By details.
Take response actions:
Isolate Entity: Sends a command to the CrowdStrike Falcon agent to disconnect the host from the network, cutting off any ongoing attack while preserving forensic data on the endpoint.
Microsoft Defender
When a Microsoft Defender agent is present on the entity:
View detailed asset information including Entity Status, Timestamp, Mac Address, DNS Name, Platform, OS Version, OS Processor, External IP, and Device ID.
View First Seen and Last Seen timestamps, Health Status, Risk Score, Managed By, and Managed By Status.
Take response actions:
Isolate Entity: Sends an isolation command through the Defender integration. The Entity Status field shows the current state (e.g., “Pending Isolation”).
User History
The User History section shows login and user activity associated with this entity. This section has two tabs:
CrowdStrike: Displays user activity data sourced from the CrowdStrike Falcon integration.
Entra ID: Displays user activity data sourced from Microsoft Entra ID, when that integration is configured.
Note
If the Entra ID tab shows no data, it most likely means the integration is not active in your environment.
User History data is particularly useful for correlating network-level detections with specific user accounts. For example, you can identify which user was logged in when suspicious outbound C2 traffic was observed.
Palo Alto
Palo Alto is a network-level integration, not an endpoint agent. When configured, it provides network response actions for blocking malicious IPs at the perimeter:
View the current Entity Status for the device.
Take response actions:
Block IP: Commands the Palo Alto integration to block all communication with a specific malicious IP address at the network level.
Unblock Requested: Shown when an unblock action is pending for a previously blocked IP.
Finalize and reset the Queue
Updating detection status is how you manage your active work list and signal to Investigator that a threat has been handled.
Reset the Priority Queue
Investigator uses a 24-hour analysis cycle. Closing detections is how you clear an entity from your active queue:
Close all detections: Use Bulk Actions to move every open alert for an entity to Closed. This signals that the current threat is handled.
Confirm the entity is cleared: Once 100% of an entity’s detections are closed, the device is automatically removed from the Highest-risk Entities panel.
Prepare for the next 24 hours
Before moving on from an entity, complete these final steps:
Handle open alerts: Any detections left open will remain on the priority list and carry their risk score weight into the next daily cycle. A lingering open detection on a resolved threat will keep the entity visible in your queue.
Document your work: Always add a final note in the Notes field before closing the last detection. This creates an audit trail for other analysts or reviewers. Use the Add Note bulk action to attach the same summary to all remaining open detections at once.
Confirm the threat is resolved: As a final verification step, click View IP Logs in the top-right header of the Entity Overview. This runs a broad query for all recent connections involving this IP. Verify that your remediation actions (such as host isolation) were successful and that no new suspicious connections have occurred before you close out.
Before you close out
Closing detections is the final technical step, but these follow-up actions help ensure the threat does not return:
Audit for persistence: If a host was compromised, use LogSearch to look for new accounts created or changes in administrative protocols (such as RDP or SSH) that occurred around the time of the First Detection.
Refine detection rules: If the investigation proved the activity was a false positive (for example, a vulnerability scanner), use the Suppress Entity action to prevent that specific device from triggering the same alerts in the future.
Update security policies: If the entity was communicating over an unauthorized protocol, coordinate with your networking team to update firewall rules or segmentation policies.
Review related entities: Use the Entity Communication diagram to check if other internal hosts contacted the compromised entity after its Most Severe Detection. This helps identify whether the threat spread via lateral movement before you isolated the host.
Quick reference
Interaction |
How to trigger |
What it does |
|---|---|---|
Entity Summary Card |
Hover over an IP or domain in the Entity column |
Shows identity, protocols, and recent detections for a quick threat check |
Entity Context Menu |
Click the dropdown arrow (▼) next to an IP or domain |
Pivots to Entity Overview, IP Logs, Detections list, or copies the value |
Detection Severity popover |
Click a color bar in the Detection Severity column |
Filters view to that severity level; includes View Open Detections link |
MITRE Tactics popover |
Click a tactic block in the MITRE Tactics column |
Filters view to detections matching that attack stage |
Destination IP hover card |
Hover over a destination IP in the Detections table |
Shows origin, ASN, protocols, and detections for that destination IP |
Expand grouped destinations (+N) |
Click +1, +5, etc. in the Destination column |
Expands grouped destination IPs from a single detection row |
External reputation lookup |
Click VirusTotal, Shodan, or Censys icon on a table row |
Opens third-party site in a new tab, pre-filtered for that IP |
Detection rule details |
Click a detection name in the Category column |
Opens a slide-out explaining what the rule detects |
Bulk Actions |
Check one or more detection rows, then use the action bar |
Close, assign, or annotate multiple detections at once |
View in LogSearch |
Click the View in LogSearch icon on a detection row |
Opens raw Zeek or Suricata logs for that specific detection |
Entity Communication pivot |
Click (…) inside a connection box in the diagram |
Opens LogSearch filtered for that specific traffic flow |
Related Questions |
Click any question in the Related Questions panel |
Runs a pre-built LogSearch query for this entity |
Dashboard refresh |
Click the refresh button (lower right) or reload the page |
Loads the latest detection data into the dashboard |
View IP Logs |
Click View IP Logs in the Entity Overview header |
Runs a pre-filled LogSearch query for all network connections involving this IP |
Suppress Entity |
Three-dot menu on Entity Summary Card or Entity Overview header |
Mutes all future alerts for a confirmed safe device |