Find details in the logs
Investigator provides detailed, searchable access to the data ingested from logs. With this data, you can build graphs, identify anomalies, and create alerts to monitor your systems.
Imported logs are available in the log search page.
Search the logs
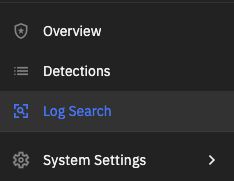
Click Log Search in the left navigation to get started.
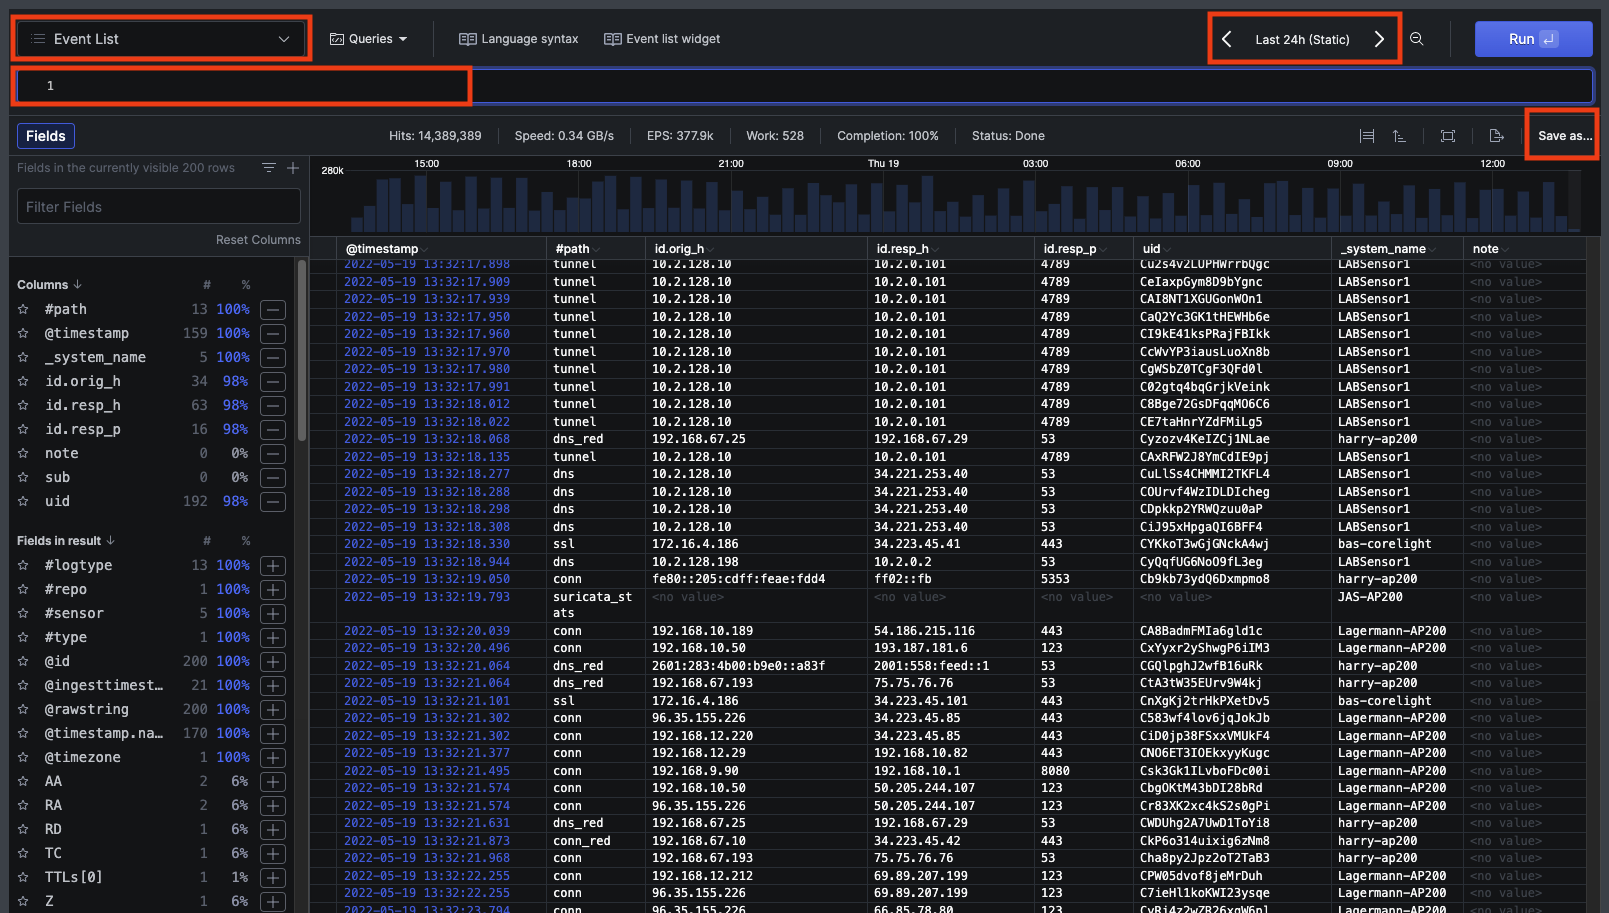
Key components of the search let you set the time interval, enter a query, and choose how to display the data.
Investigator uses Falcon LogScale (based on Humio technology) to provide these extensive search capabilities. Consult the Humio documentation for a complete reference to the functionality.
These topics are a great place to start.
Create and customize search queries
(This link to the Language Syntax help is also available at the top of the Log Search page.)
As an example, follow these steps to find the top entries for logs and display the results as a pie chart.
Use the query
top(path)to display the top entries for the different log types.The page shows you the search progress.
Add filters to the query to focus the results.
From the top left menu, you can change how the results appear.
For example, you can change to a pie chart or a table.
Click Save to add the query to your saved list, or save in several other formats such as a Dashboard widget.
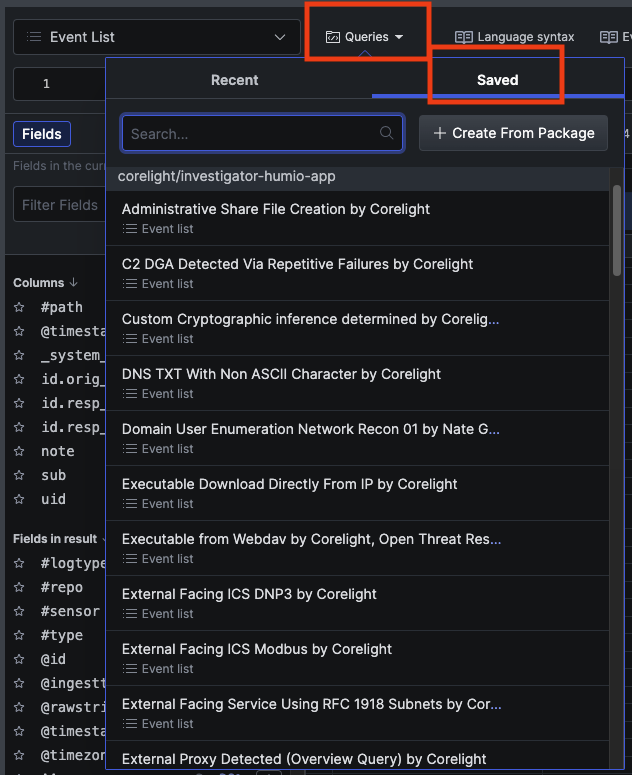
The Log Search page also includes a set of saved searches to assist in threat hunting. To access the saved searches, click Queries and choose the Saved tab.