Identify and manage threats through the Detections page
Investigator helps you monitor and manage alerts by grouping them as detections and providing simplified workflows and instructions to process and resolve them.
What are detections?
A detection is an aggregation of alerts from the same alert category and entity combination. Investigator creates detections when an entity generates an alert for an alert category. Future alerts from the same alert category and entity pair are appended to the same detection.
Detections are accessible to Admin, Analyst, and Viewer users (although Viewers cannot see the action buttons associated with detections).
For more information, see Overview of alerts and detections.
How to investigate a detection
Here are the basic steps to investigate a detection:
From the Detections page, review the list of discovered detections.
The list summarizes basic information about each detection. You can drill down to learn more about detections and their associated entities and alerts.
Sort and filter detections.
You can sort detections by severity score and time of detection.
You can filter detections by severity, status, alert category, alert type, source, destination, or assignee.
View essential information about a detection in the Quick View panel.
View complete information in the Detailed View.
The Detailed View includes information provided by the Corelight content team and can include description, significance, validation, next steps, and associated MITRE ATT&CK techniques.
Some detections provide AI generated descriptions and let you Ask GPT for more information through pre-formed prompts. For more information, see GPT integration.
The Detailed View also shows alerts for the detection, related detections, and related entities.
Add a note to a detection to save research details and context and share with other users.
Assign a detection to any user in the system for further analysis.
Exclude an entity from a detection.
Send To ServiceNow as a security incident.
Close a detection.
Detections page and summary view
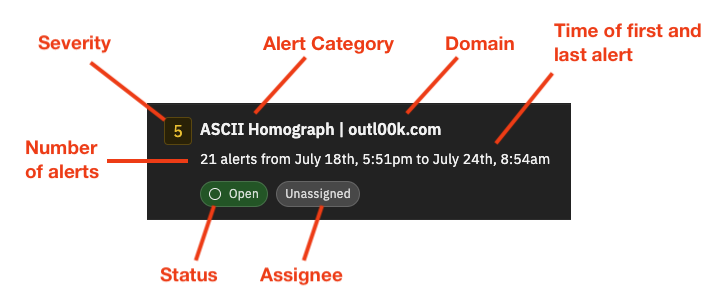
The Detections page shows a summary of each detection. Each detection includes these details:
Severity – a number ranging from 1 to 10; more severe threats have a higher score
Alert Category – the name of the security alert
Entity – the source (originating entity) and destination (responding entity) for the detection in the form of an IP address or domain name
With a CrowdStrike or Microsoft Defender integration, the detections show additional host information from CrowdStrike or Microsoft data to provide even more context and let you isolate entities from network activity in response to security events.
Number of Alerts in the detection
First Alert Time – time of the first alert in the detection
Last Alert Time – time of the most recent occurrence of the alert in the detection until the detection is closed
Status – open or closed
Assignee – indicates a user has been assigned to the detection or the detection is unassigned.
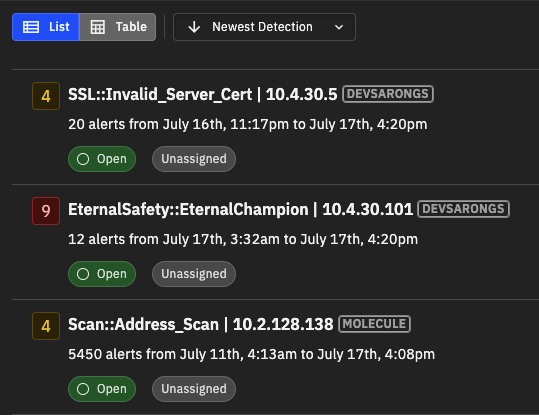
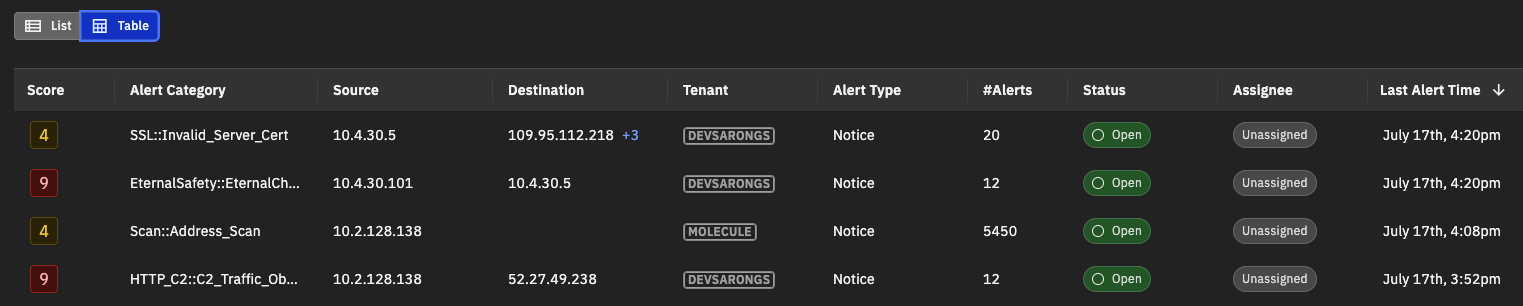
By default, detections appear in the list view. If you prefer a more structured and concise representation of the detections, you can switch to the table view. The table view lets you scan rows and columns to find relevant data. You can switch between views using the List and Table buttons under the filter options.
Detections in the list view
Detections in the table view
The sort and filter options along the top of the results help you focus the list of detections and the Quick View panel provides more information about the detection.
Note
The Detections page does not automatically refresh. If new detections are available for your time window, the Refresh icon in the time window is blue. Click the Refresh icon to show the new detections in the results. If new detections are not available, the Refresh icon is gray. The time window shows the length of time since the last update.
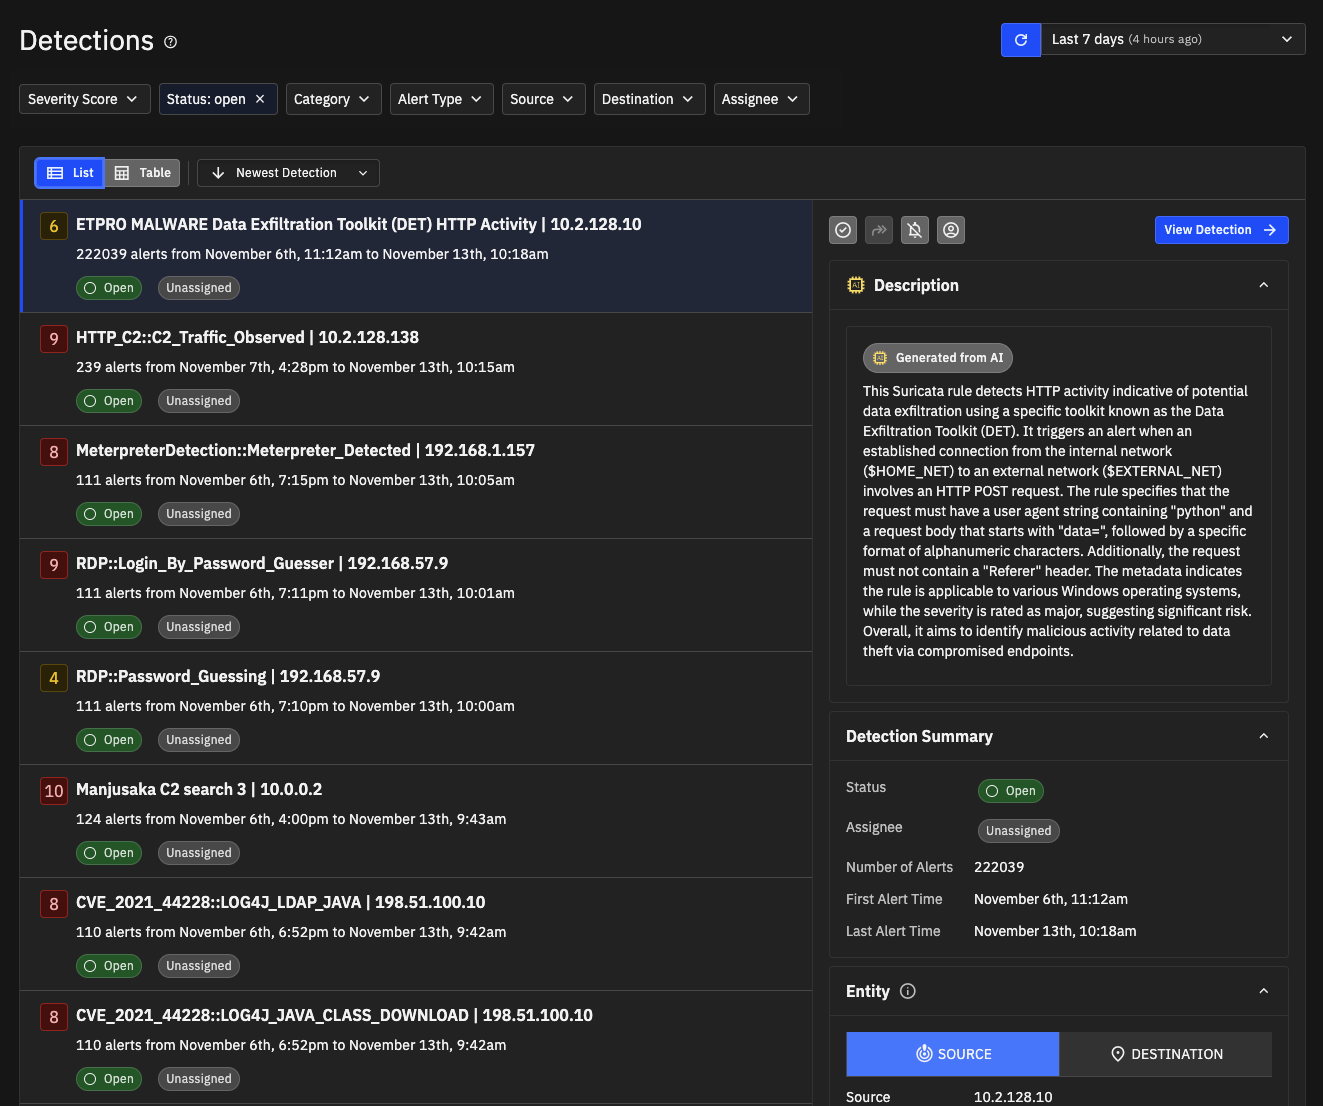
Quick view of detection information
Each detection displays a Quick View panel to the right. This panel provides essential information and actions for the detection, including
Description of the detection. Machine learning alerts and notices from Corelight collections include a description. Suricata alerts include a description when available. Custom generated alerts will not have a description.
Note
AI-generated content is identified by an icon that appears next to the description. Although our goal is a detailed and accurate description, use your judgment for any AI generated description. For more information about the AI integration, see GPT integration.
If Agentic Triage is enabled, the Description and Significance fields for Suricata detections are replaced by an AI-generated Rule Description, identified by a purple diamond icon. The Rule Description provides an AI interpretation of the Suricata rule logic and why it triggered, including confidence level and behavioral context. See Investigate threats with Agentic Triage for details.
Significance – the potential impact of this detection for machine learning (ML) detections and some notices.
Detection Summary
Status – if the detection is open or closed.
Assignee – indicates if the detection is assigned to a user or if it is unassigned.
Number of alerts
First alert time and last alert time
Entity for the detection, including the source and destination identified by IP address or domain name. Some detections might not have a source or destination and some detections might have multiple destinations. If a detection has multiple destinations, the quick view panel indicates the number and lets you view the multiple entries by hovering the pointer over the number of entities. The Entity panel also indicates if the entity is suppressed.
With a CrowdStrike or Microsoft Defender integration, the detections show additional host information from CrowdStrike or Microsoft data to provide even more context and let you isolate entities from network activity in response to security events.
For IP addresses in table view, you can hover the pointer over the address to view related detections or logs, and you can perform actions such as isolating or suppressing an entity. Addresses recognized as potential security threats on the internet include links pre-populated with the IP address to enrichment services such as VirusTotal, Shodan, and Censys for additional research. You do not need a custom integration in Investigator to access these sites, and the platforms offer both free and paid tiers.
Alert Category
Alert Category – click the name to see to the full entry in the Alert Catalog and customize the severity score
Severity
Type – Machine Learning, Notice, Search Based, Suricata, YARA, or Anomaly
MITRE ATT&CK techniques (if available) – Notice, ML and Anomaly detections that Investigator can map to the MITRE ATT&CK framework include links to the relevant MITRE ATT&CK techniques.
Buttons at the top of the Quick View let you perform any of the following actions for a detection:
- Close the detection
- Add Note
- Send to ServiceNow as a security incident
- Suppress Entity from a detection
- Assign a detection to a user
Tip
In table view, the action icons appear when you hover over a table row and also in the Quick View panel.
Detailed view of the detection information
By default, the Detection page displays a Quick View panel with more information for the selected detection. Click the View Detection button in the Quick View panel to display a more complete view of the detection in a full page view.
The Detailed View includes all the information and actions available in the Quick View, plus this additional information (as applicable for each alert type):
Description – explains the detection
Significance – the potential impact of this detection for machine learning (ML) detections and some notices.
Validation – how to assess the correctness of the detection.
Tip: you might need to click See More to display this section.
Next Steps – recommendations on how to address the detection (for ML detections and some notices).
Tip: you might need to click See More to display this section.
Note
If Agentic Triage is enabled, the Next Steps section also appears for Suricata and other alert types, displaying AI-generated investigation recommendations identified by a purple diamond icon. See Investigate threats with Agentic Triage for details.
YARA detections show the rule definition without an AI-generated description.
Ask GPT – Corelight-provided alerts and detections include an Ask GPT section that lets you query GPT from OpenAI about the alert or detection through pre-formed chat prompts.
Click a prompt to ask GPT for additional details about an alert generated by a detection. Prompts might let you ask “What type of attacks might be associated with this alert?” or “What techniques specific to this alert might an adversary use?” As you get an answer, related queries appear as appropriate and available.
You can use the Request More link to send feedback to the Investigator team and suggest prompts related to the detection. (Note that this feedback is not interactive.)
If preferred, you can turn off the integration for GPT (Non-Private Data) in General Settings to remove this feature.
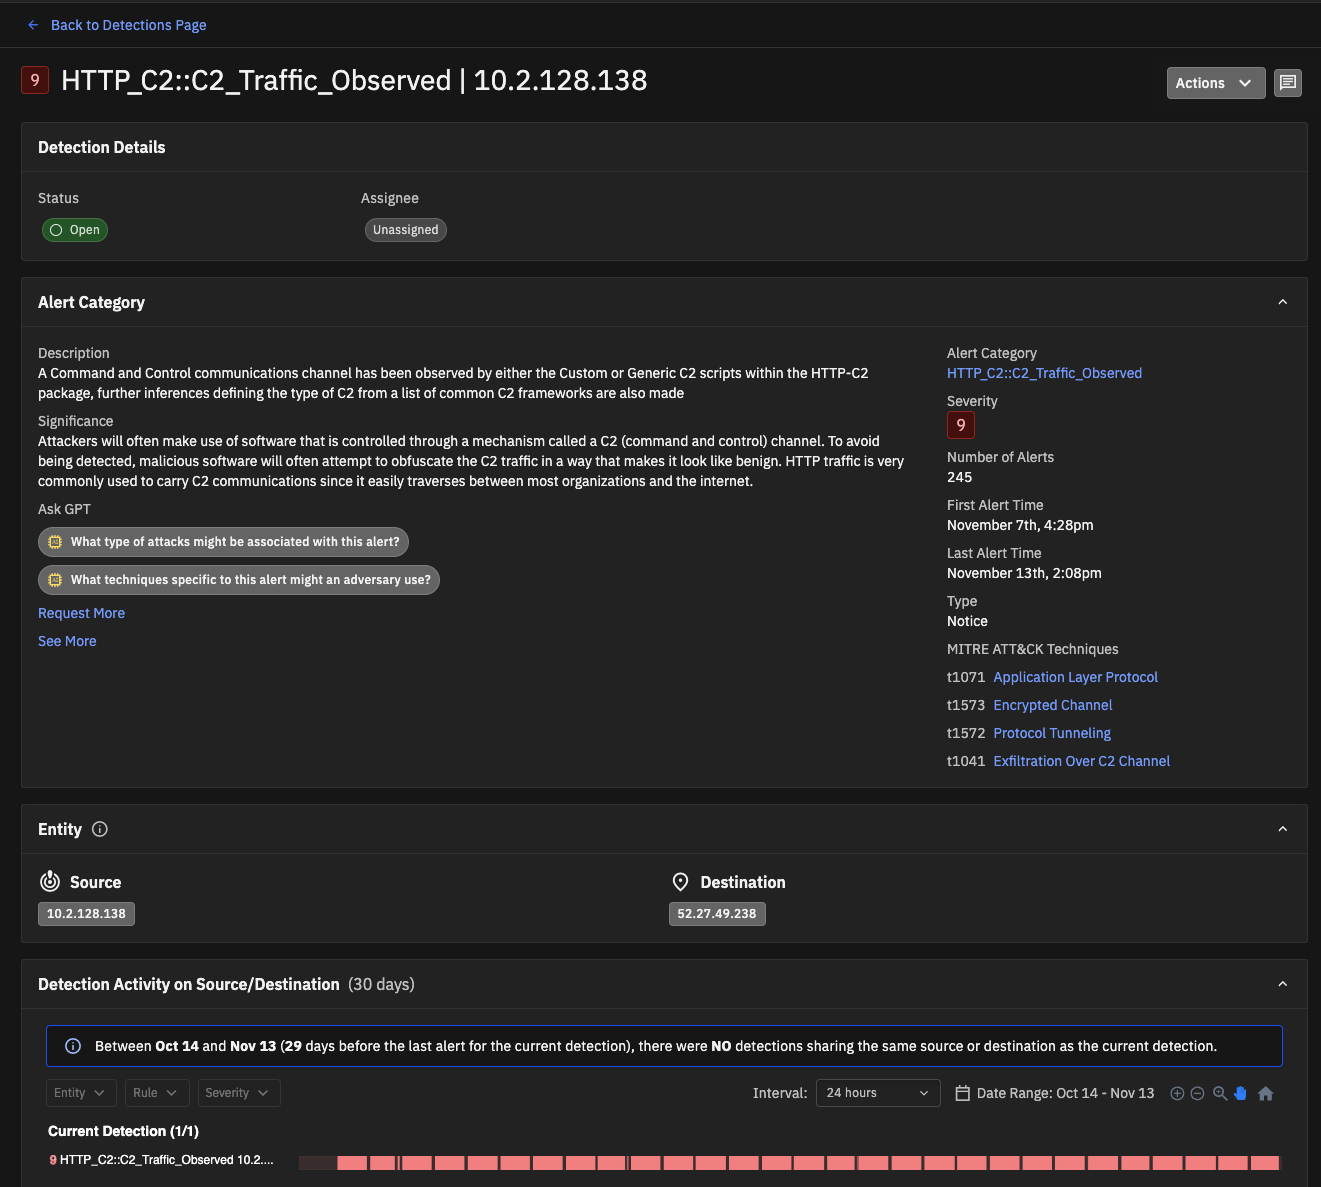
The Entity panel identifies the source and destination for the detection, if available. Some detections can have multiple destinations. Click a source or destination to show more details.
Below the Entity panel appear details for Detection Activity. This panel shows additional context and lets analysts review related detections, alerts, entities, and alert categories to see a more complete view. The alerts are grouped by the current detection, alerts related to the source/dest pairs, alerts related only to the source, and alerts only related to the destination. (An alert will only appear in one grouping.)
At the top of the Detection Activity is a timeline view. Brightly colored sections indicate when alerts triggered, and larger sections indicate a greater density of alerts. Buttons let you zoom, pan, and reset the view. You can also specify a date and time interval for the view, and filters let you focus the results to an entity, a rule, or a severity range. In the timeline, each grouping shows the top alerts, ordered by severity, and a number indicates the number of additional alerts in the grouping. Mouse over a timeline entry to view more details.
Below the timeline, the page provides more information about the associated alerts and related detections that contributed to this detection. Click anywhere on a row to highlight it and open the Alert Details panel on the right. The Actions column contains two icons: the Investigate icon (dark), which opens a menu with View Related Logs and View in Log Search options, and the View Alert Details icon (green eye), which opens the Alert Details panel on the right.
The Alert Details panel contains the following collapsible sections:
Alert Details – Alert Name, Timestamp, UID, Source IP, Destination IP, and Type.
Connection Details – Packet history, Protocol (service), Destination Port, Bytes Sent, Bytes Returned, Local Originator, and Local Responder. Click See More to view the full raw Zeek connection log.
DNS Details – shows N/A when no DNS data is available for the alert.
HTTP Details – URI, Method, Post Body, and User Agent. Click See More to view the full raw Zeek HTTP log.
SSL Details – shows N/A when no SSL data is available for the alert.
File Details – Mime Type, Receiver Hosts, Seen Bytes, Filename, and SHA1. Click See More to view the full raw Zeek files log.
For Suricata detections with correlated alerts, a Related Suricata Alerts section also appears, showing Source IP, Destination IP, Port, and Protocol for each correlated alert.
Note
If Agentic Triage is enabled, a Payload Summary section also appears between Alert Details and Connection Details, providing an AI-generated analysis of the decoded payload content with a View Full Payload option. An Analyze Activities button in the Alert Details section opens the Alert Connection Insights panel with AI-generated analysis including Indicators of Compromise, Alert Summary, Alert Beacons, Unusual Findings, and Attack Tactics. Both features are identified by a purple diamond icon. See Investigate threats with Agentic Triage for details.
For Suricata and Notice alerts, key data points are automatically extracted and displayed in the alert.
Suricata alerts can include a payload and an option to view full payload details. (The payload is the portion of a packet that Suricata examines beyond the headers to detect threats that may be hiding malicious content.)
Important
To display a Suricata payload, you must configure your sensor to include the payload, a feature available in Corelight Sensor v27.11 and later. For more information, see Suricata options in the Corelight Sensor release notes. You also need to enable Private Data sharing with the GPT Integration.
For ML alerts, you can click ML Analysis to show details about the model score, including analytics that contributed to the calculation of that score.
Click the Download PCAP button to download PCAP data captured by the sensor.
Note
The Download PCAP button is only available if you have configured your sensor to add the PCAP link to the logs. For details, see PCAP file retrieval in the Corelight Sensor User Guide.
An Actions menu in the upper-right corner of the detection details lets you perform these actions:
Copy Detection URL – copies the detailed view page location and so you can share it as a unique URL for the detection
To the right of the Actions menu is the Notes icon. Click this icon to review any comments that have been added to the detection to track history and context added by users.
Sort and filter detections
By default, detections appear in a list that shows the most recent activity first and the detections appear for the last 7 days. You can change the time period to range from one hour to three months. You can also specify a custom date range.
Note
When you change the time window for detections, the time setting applies to all parts of Investigator that use a time window.
You can sort detections based on:
Newest Detection – show the most recent detections first
Oldest Detection – show the oldest detections first for the specified time window
Highest Severity – show the most severe detections first
Lowest Severity – show the least severe detections first
You can filter detections based on:
Severity Score – use the slider to specify a minimum and maximum score for the results. By default, all scores are included.
Status – open and/or closed.
Open – the alerts/detection have been generated and are awaiting investigation and resolution.
Closed – the alerts/detections have been fully investigated and resolved, and no further action is required or the detection was open for more than a week.
Category – Limit the results based on an alert category. This search box suggests matches based on values found in the filtered results; start typing keywords to see available filtering values.
Alert Type – Limit the results based on an alert type, such as machine learning, notice, search based, Suricata, YARA, or anomaly.
Source and Destination – Find detections by IP or domain. These filters suggest matches based on values found in the filtered results; start typing search terms to see available filtering options.
Assignee – A search box lets you find and select one or more assignees from the full list of users associated with the account and show only detections assigned to those users. You can also show only unassigned detections or detections assigned to you.
You can select multiple values in a single filter and combine filters to focus results. Once you choose filter values, click Apply.
Active filters appear at the top of the Filters pane.
You can reset custom filters. Click Reset to clear all filters, or click the X next to a specific filter label to remove it. For a filter with multiple values selected, click the filter to adjust the selected values, or click the X to remove the entire filter.
Add a note
You can add comments to a detection to include research notes and context for yourself and others to discover and review.
To add a note to a detection
From the Quick View panel or the Detailed View, open the Actions menu and choose Add Note.
Enter the text for your note.
Click Add Note.
Notes for a detection are available on the detection details page. Click the Notes icon to the right of the Actions menu to review the notes. Each note identifies the user that added the note and a timestamp.
Once added, you cannot edit or delete a note.
Exclude an entity
Analyst and admins can exclude entities from a detection. Excluded entities do not generate new alerts for the alert category. Typically, you exclude trusted entities so you can focus on other entities.
To exclude an entity from an alert category
From the Quick View panel or the Detailed View, open the Actions menu and choose Suppress Entity.
A dialog box prompts for confirmation.
Click Suppress Entity.
If excluded, you can use the Actions | Unsuppress menu item to restart alerts for the entity.
You can see a list of suppressed entities for an alert category in the Alert Catalog.
Assign a user to a detection
You can assign a detection to any admin or analyst user, including yourself.
To assign a detection
From the Quick View panel or the Detailed View, open the Actions menu and choose Assign To.
Search for an assignee and select their alias.
Each assignee is listed by their account alias.
Click Apply.
Once assigned, you can change the assignee or revert to Unassigned. Users do not get notified when assigned a detection, but they can sort based on their assigned detections.
Send a detection to ServiceNow
If an analyst or admin identifies a detection as a potential incident, they can send the detection to their ServiceNow instance. A detection sent to ServiceNow creates a security incident for further investigation and can initiate response workflows.
Important
Users send detections manually on a case-by-case basis.
To enable this functionality, an admin for your account needs to provide access settings for your ServiceNow instance in the integration settings.
To send a detection to ServiceNow
From the Quick View panel or the Detailed View, open the Actions menu and choose Send To.
You are prompted to confirm the action.
When sent, the status for the detection changes to closed, the username of the person who sent to detection is added to the details, and an icon indicates the detection has been sent to ServiceNow.
Important
Once you send a Detection to ServiceNow, it cannot be reverted or reopened.
When you send a detection to ServiceNow, Investigator includes these fields:
Description of the detection
Alert category name
Severity score
Detection status (will always be closed since Investigator closes detections once sent to ServiceNow)
Entity
Entity type
Assignee
Number of alerts
Unique URL for the detection
Detection created time
Last updated time
Tip
Corelight video on YouTube: How Corelight’s ServiceNow integration speeds response
Close a detection
Without any user activity, Investigator automatically closes the detection one week after creation. (Admins can configure the autoclose time period.) Additionally, analysts and admins can close detections when they determine it is not a security issue or when they have addressed the issue.
If your active filters only show Open detections (the default), the closed detection no longer appears in the list. Once you close a detection, you cannot re-open it.
Note
The system automatically closes detections 7 days after creating the detection.
To close a detection
From the Quick View panel or the Detailed View, open the Actions menu and choose Close Detection.
When prompted to confirm the action, click the Close Detection button.
A message appears when the action completes successfully.
Note
If the detection is closed and alerts with the same attributes, Investigator creates a new detection for the same alert category and entity pair.
You can still perform actions on closed detections, such as assign a user or suppress an entity.