Investigate threats using Agentic Triage
Agentic Triage is an automated investigation capability built into Corelight Investigator that runs daily and delivers pre-analyzed, evidence-backed threat assessments for your environment’s highest-risk entities. When you open an investigation, Agentic Triage has already analyzed these entities, correlated their detections, executed expert-authored playbooks, and produced a verdict with supporting evidence.
When Agentic Triage is enabled, it serves as the starting point for your investigation workflow. Instead of manually gathering context for each entity, you arrive at a pre-investigated case and can quickly confirm or act on the AI’s findings. From there, you transition directly into the Entity Workflow to validate evidence and take response action.
This topic covers the AI-specific features that Agentic Triage adds to your workflow. The Entity Overview, Detections Activity, Bulk Actions, and EDR Details are all available whether or not Agentic Triage is enabled. Agentic Triage adds AI-generated analysis on top of that foundation; it does not replace it. For the full investigation and response workflow, see Investigate threats using the Entity Workflow.
Note
Before you start:
Agentic Triage requires the GPT (Private data) integration to be enabled. See Enable Agentic Triage below to get set up.
New to Investigator? Read Investigate threats using the Entity Workflow first.
All AI features can be disabled at any time from settings.
Important
Content generated by Agentic Triage is produced by Corelight AI using a large language model. AI-generated findings may contain errors or omissions. Always use your judgment and verify findings against the raw evidence before taking response action.
How Agentic Triage works
Agentic Triage runs on a 24-hour cycle and analyzes up to 10 of your highest-risk entities each day, selected based on detection severity and risk score. It uses a multi-agent architecture:
Detection Triage Agent examines alert logic and network traffic for each entity.
Entity Triage Agent profiles the entity’s normal behavior and assesses deviation.
Report Generation Agent assembles the findings into an actionable, evidence-backed threat assessment.
During each analysis cycle, the engine evaluates network activity from the preceding seven days. This allows the system to identify both active threats and slow-moving attack patterns that may span multiple days. When you pivot to LogSearch from an AI finding, the seven-day window is applied automatically.
Every conclusion is grounded in raw network telemetry, including Zeek logs, Suricata alerts, and PCAP. The AI does not generate generic summaries; it cites specific evidence for each finding, which you can inspect directly via LogSearch.
Workflow summary
When Agentic Triage is enabled, your workflow follows this sequence. Most steps are Agentic Triage-specific; steps 7 and 9 continue in the standard Entity Workflow.
Start from the Dashboard: Check the AI Insights column to identify which entities have been analyzed and prioritize any marked Needs Human Review.
Use the AI Insights Popover: Click a verdict badge to read a summary of the analysis and decide whether to open the full Entity Overview.
Review the Analysis Summary: Open the Entity Overview and read what the AI concluded, what threats were identified, and any limitations in the analysis.
Review Detections: Read the Detections AI summary line for a one-sentence AI interpretation of the detection data.
Review Investigation Findings: Expand finding cards and use View Details to confirm each finding against the raw evidence before acting.
View the Playbook: Optionally review the step-by-step investigative process the agent performed.
Investigate Threats Using the Entity Workflow: Validate findings in the Detections Activity table and pivot to LogSearch to verify evidence.
Review Recommended Responses: Follow the panel’s guidance, take containment action if warranted, and submit thumbs up / thumbs down feedback on the AI analysis.
Investigate Threats Using the Entity Workflow: Finalize the queue by closing all detections, documenting your work in Notes, and verifying with View IP Logs.
Enable Agentic Triage
Agentic Triage requires the GPT (Private data) integration, which allows Corelight Investigator to send your private network telemetry to Corelight’s AI infrastructure for analysis. When Agentic Triage begins running on its daily cycle, results appear in the Dashboard and Entity Overview automatically.
Agentic Triage is available to:
New tenants (on or after June 1, 2026): Agentic Triage is automatically active with no additional setup required.
Existing tenants with GPT (Private data) already enabled: Agentic Triage will be automatically enabled with no action required.
Existing tenants without GPT (Private data) enabled: Enable the GPT (Private data) integration to activate Agentic Triage. This must be done by an Admin.
Enabling or disabling the GPT (Private data) integration must be done by an Admin; analyst users can view integration settings but cannot make changes.
Disabling the GPT (Private data) integration also disables Agentic Triage. The backend stops running new analyses starting the following day, and Agentic Triage results are no longer shown in the UI.
For full details on the integration, including how to enable it, see GPT integrations.
Start from the Dashboard
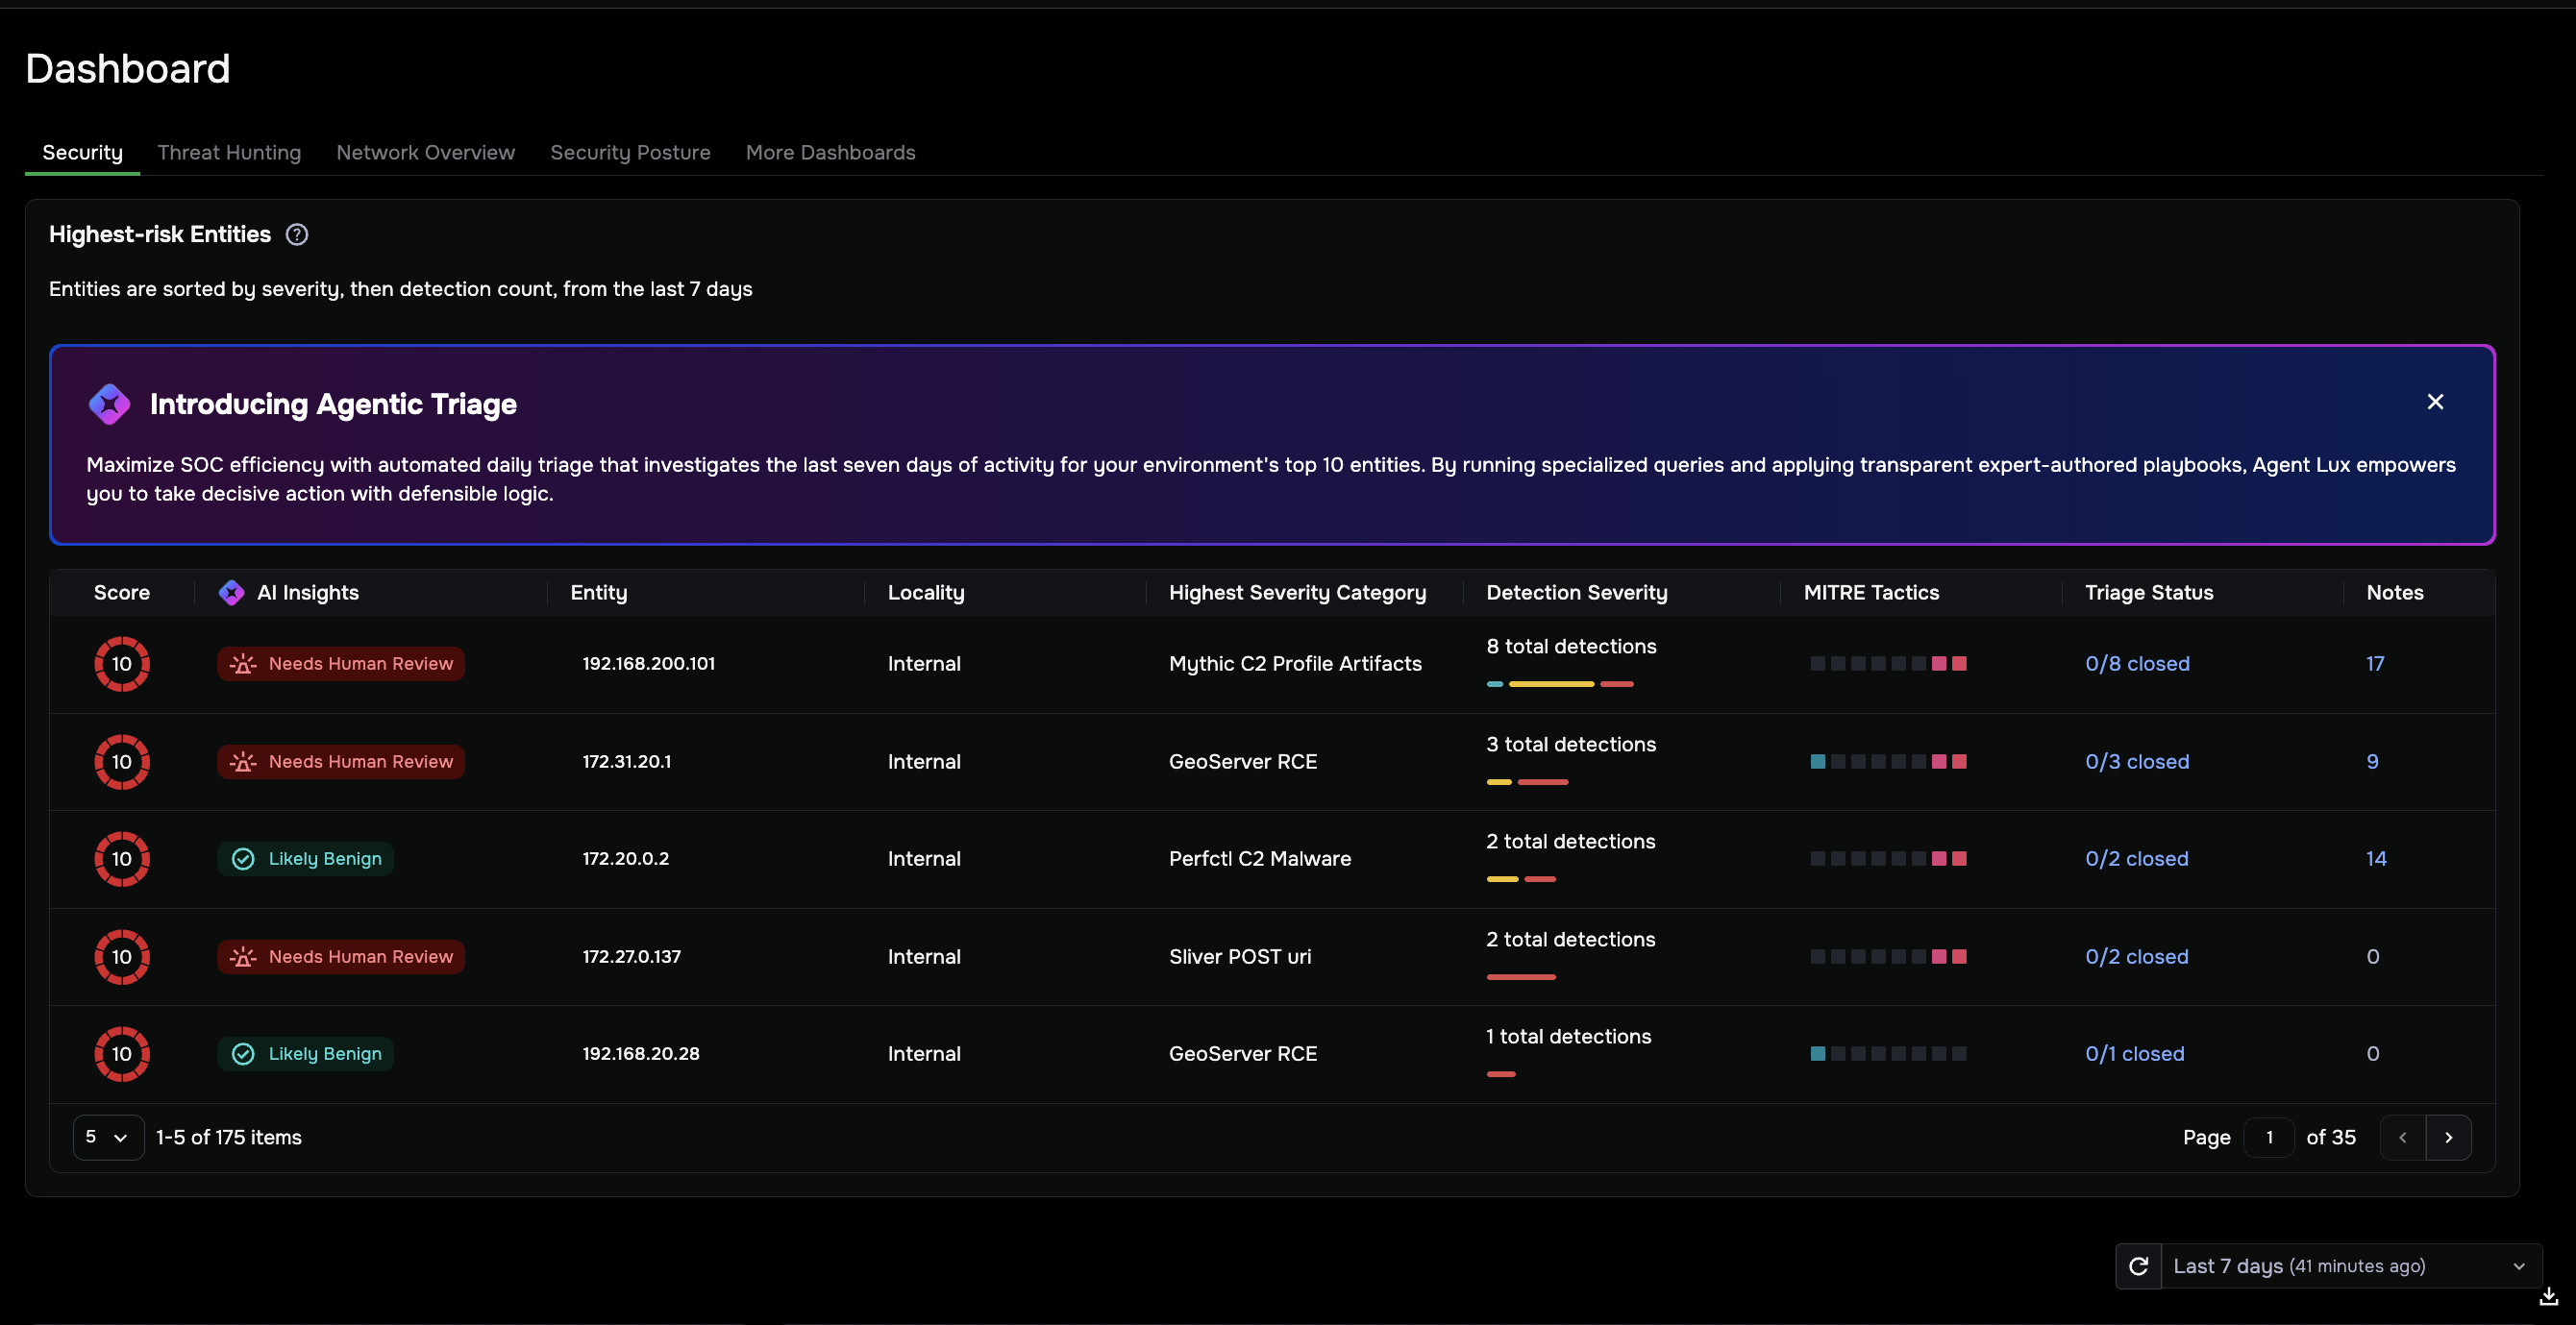
When Agentic Triage is enabled, the Highest-risk Entities panel on the Dashboard | Security tab includes an AI Insights column that displays the AI confidence verdict for each entity that has been analyzed.
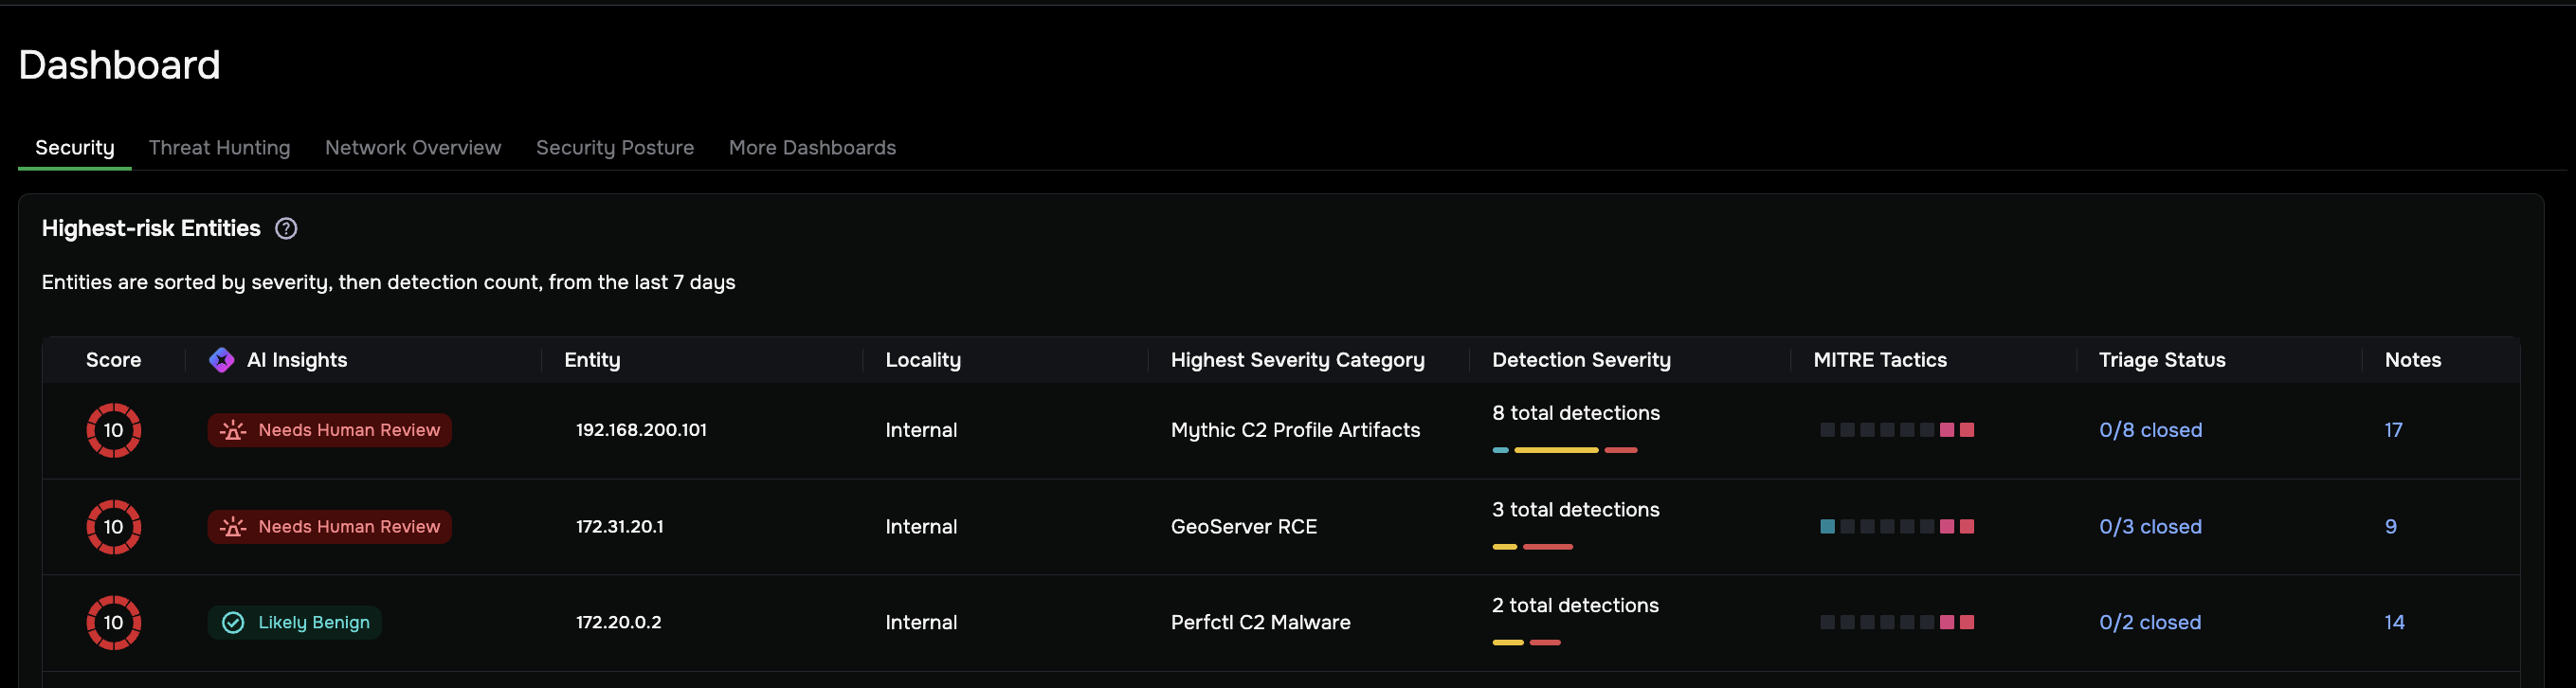
Read the AI Insights column
The AI Insights column shows the AI confidence verdict for each entity:
Needs Human Review (shown in red): The AI agent has identified significant risk indicators that warrant immediate investigation. This entity should be your highest priority. Always validate findings against the raw evidence before acting; this verdict is not a confirmed compromise.
Suspicious (shown in amber): The AI agent identified activity that warrants investigation but could not reach a high-confidence conclusion. Treat this entity as a secondary priority after any Needs Human Review entities.
Likely Benign (shown in green): The AI agent reviewed the detections and found evidence supporting a non-malicious explanation.
Undetermined: The AI agent was unable to reach a conclusion due to mixed signals or insufficient data. Review the Investigation Findings to determine whether additional context would clarify the verdict.
No verdict / No agentic report (—): This entity has not yet been analyzed by Agentic Triage, or no agentic report is available. For these entities, use the standard Entity Workflow to investigate manually. See Investigate threats using the Entity Workflow for instructions.
AI confidence verdicts are updated once per day. The badge reflects the most recent completed analysis, not real-time activity.
Score vs. AI Insights
The Score (detection severity score) and AI Insights (AI confidence verdict) are not the same thing:
The Score (detection severity score, the numbered circle, 1–10) reflects the highest severity detection triggered by the entity.
AI Insights (AI confidence verdict, such as Needs Human Review) reflects the AI agent’s assessment of the overall threat after correlating all available evidence.
These two values are independent and will not always agree. An entity may have a score of 10 and a verdict of Likely Benign, or a low score with a Needs Human Review verdict. This is expected behavior. Always consider both when prioritizing your work.
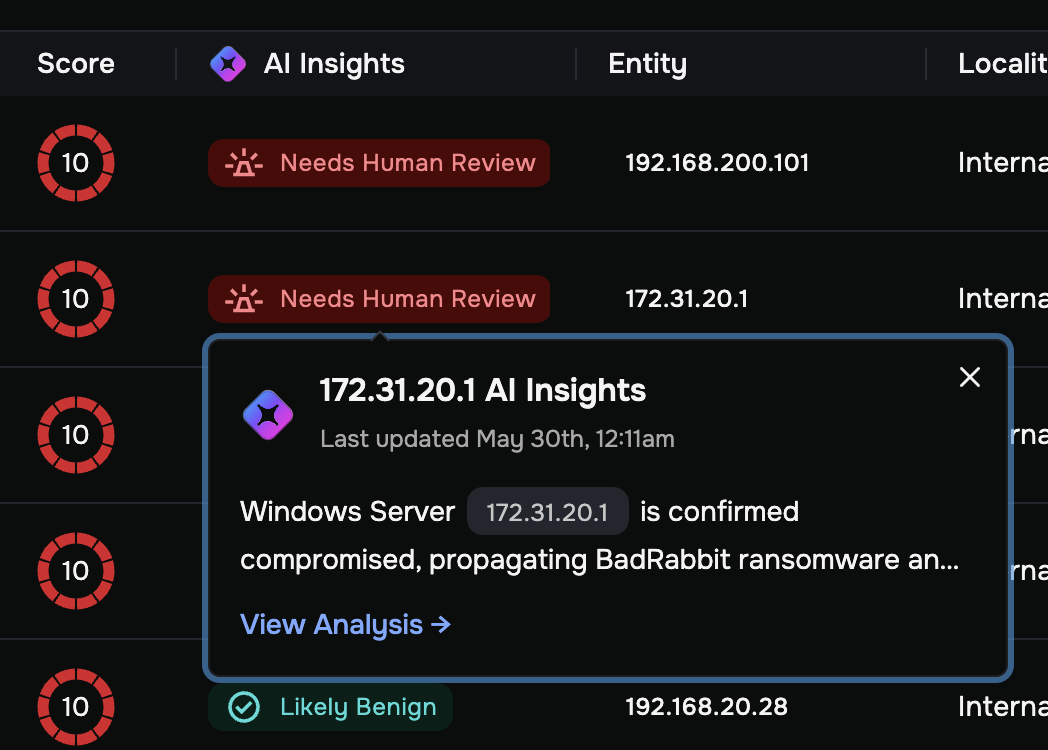
Use the AI Insights popover
How to use it: Click an AI confidence verdict in the table.
The AI Insights popover gives you a summary of the analysis without opening the full Entity Overview:
Entity IP and last updated timestamp: Confirms when the analysis was run.
Summary text: A concise description of what the AI agent found, citing the entity’s IP address and key behaviors identified.
View Analysis →: Opens the full Entity Overview directly to the Analysis Summary for a complete breakdown.
Use this popover to quickly determine whether an entity warrants a deeper investigation before committing to opening it.
Open the Entity Overview
When the AI Insights popover gives you enough to decide an entity warrants a full investigation, open the Entity Overview to review the complete analysis, including the AI verdict, supporting evidence, playbook, and recommended responses.
To open the full Agentic Triage analysis for an entity, click any of the following in the Highest-risk Entities panel, or use the Entity Summary Card:
View Analysis → in the AI Insights popover
Number in the Score column
IP address in the Entity column
Internal or External in the Locality column
Entry in the Highest Severity Category column
The green Investigate button in the Entity Summary Card (hover any entity to open it)
When Agentic Triage is enabled, the Entity Overview has an expanded layout:
The Entity Information panel and the Analysis Summary panel appear side by side at the top.
The Detections panel includes an AI-generated summary line below the header, providing a one-line AI assessment of the detections before you review the details.
The Investigation Findings panel appears below the Detections Activity section.
The Recommended Responses panel appears at the bottom of the page.
The View IP Logs button and the three-dot menu (…) in the header remain available, giving you immediate access to raw logs and entity actions at any point during your review.
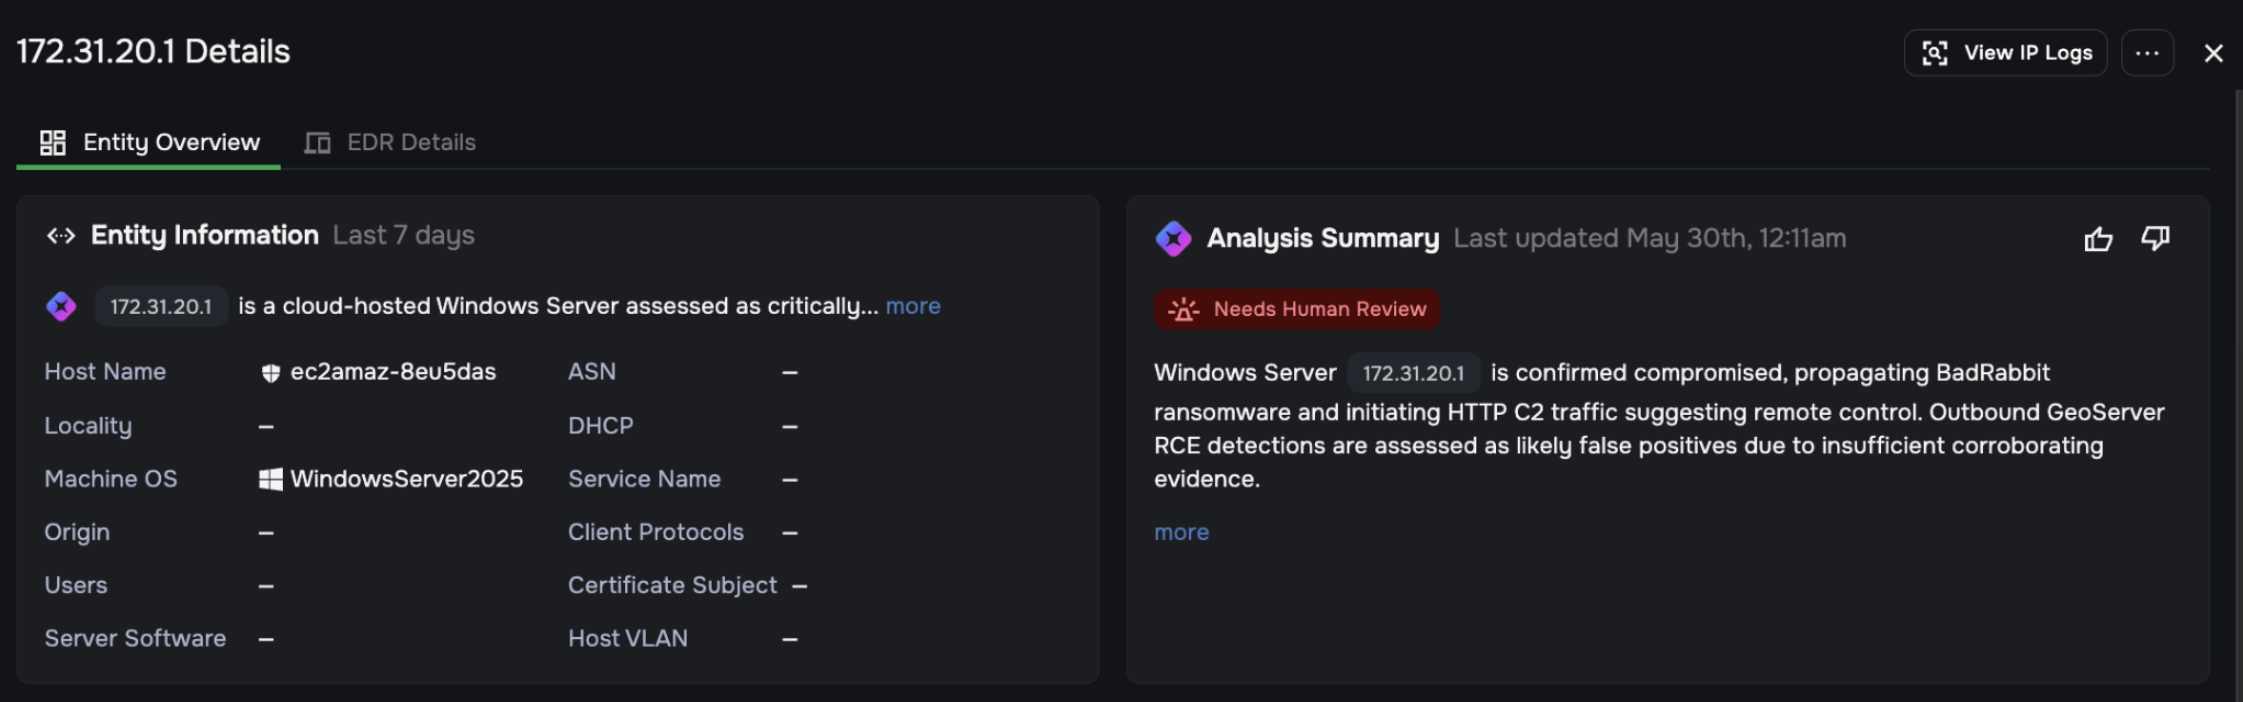
Review the Analysis Summary
The Analysis Summary panel appears in the upper right of the Entity Overview, next to the Entity Information panel.
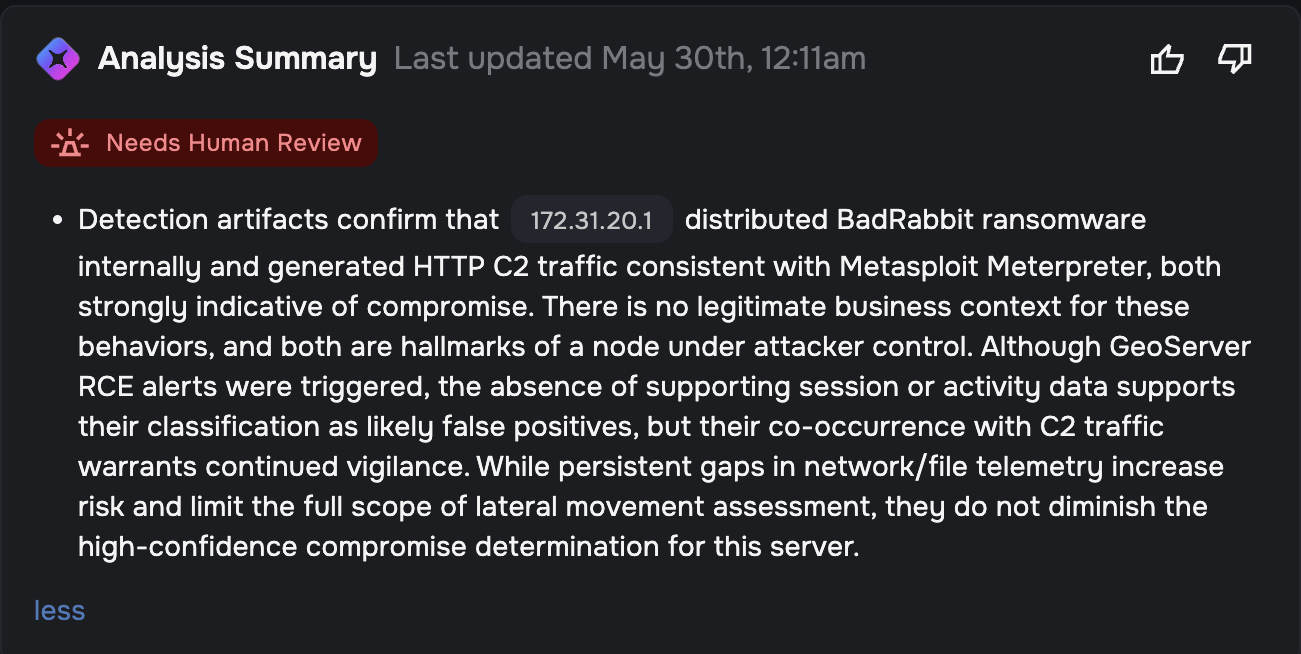
What it shows:
AI confidence verdict (such as Needs Human Review): The AI’s overall assessment at a glance.
Summary text: A narrative description of the AI’s findings, including the specific behaviors observed, the evidence that supports the verdict, and any limitations in the analysis (such as missing host context or incomplete session data). Click more to expand the full summary or less to collapse it.
Last updated timestamp: Shows when the analysis was last run.
Thumbs up / Thumbs down: Feedback icons that let you rate the quality of the AI analysis. Submit feedback after you have reviewed the evidence and confirmed or overturned the verdict: thumbs up if the AI’s conclusion matched what you found in the data, thumbs down if the verdict was wrong or the evidence didn’t support it. This feedback helps improve future analysis quality.
How to use it: Read the Analysis Summary first. It tells you what the AI concluded and why. Use it to orient yourself before reviewing the detailed evidence below. The summary will cite specific threat names (such as Trickbot, BadRabbit, or Fastloader) and behaviors (such as C2 communication, ransomware delivery, or credential exfiltration) that the agent identified, so you know exactly what you are looking for when you drill into the findings.
Note
The Analysis Summary is the AI’s conclusion, not a final verdict. Every claim in the summary is backed by specific evidence visible in the Investigation Findings and Key Findings panels below. Always review the supporting evidence before taking response action.
Review Detections
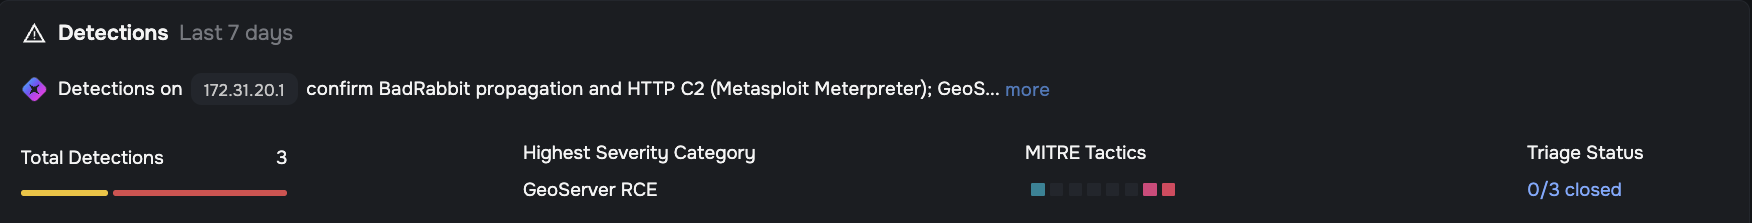
The Detections panel works the same way as in the standard Entity Workflow, with one addition: when Agentic Triage is enabled, an AI-generated summary line appears directly below the Detections panel header, marked with a purple diamond icon. This line summarizes what the AI found across the detection data, including detection names, patterns, and behaviors, before you review the individual metrics below.
This summary is distinct from the Analysis Summary panel verdict. The Analysis Summary reflects the AI’s overall entity-level conclusion; the Detections summary line focuses on what the detections themselves indicate.
Click more on the summary line to expand the full AI interpretation. The expanded text typically names specific threat families (such as Trickbot or Fastloader C2) and behaviors observed across the detections, which helps you know what to look for when you review the detection table and timeline below.
All other Detections panel interactions (clicking MITRE tactic blocks, Detection Severity color bars, Triage Status, and detection timeline milestones) work the same way as described in Investigate threats using the Entity Workflow. When you click View Detections from the Entity Overview to go to the Detections page, Agentic Triage adds an AI-generated Rule Description to Suricata detections in the Quick View panel; see Identify and manage threats through the Detections page for details.
Analyze individual alerts
When you open an individual alert from the Detection Activity table or the Detections page, Agentic Triage adds two AI-powered sections to the Alert Details panel that are not available without Agentic Triage enabled.
Alert Connection Insights
To access Alert Connection Insights:
In the Detections Activity table, hover over any row and click the green View Detection eye icon.
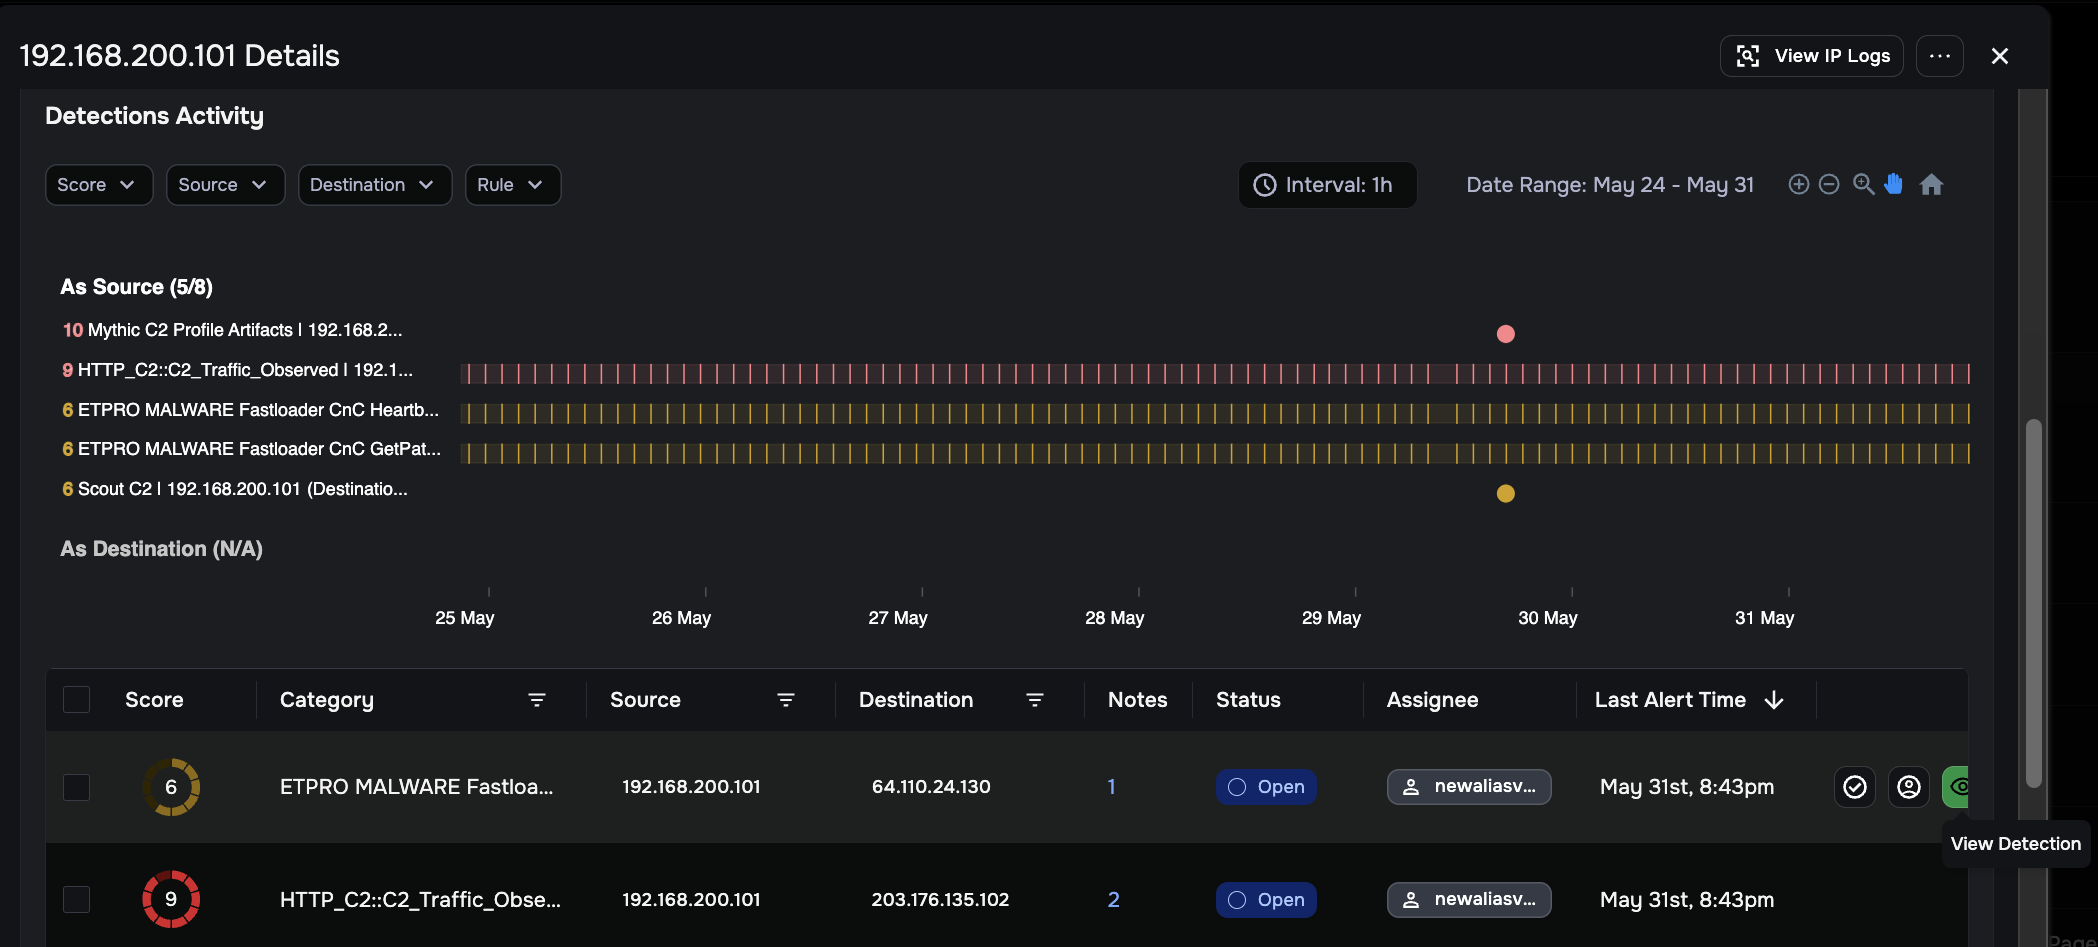
On the detection detail page, click the green View Alert Details eye icon in the Actions column of the log table to open the Alert Details flyout panel on the right.
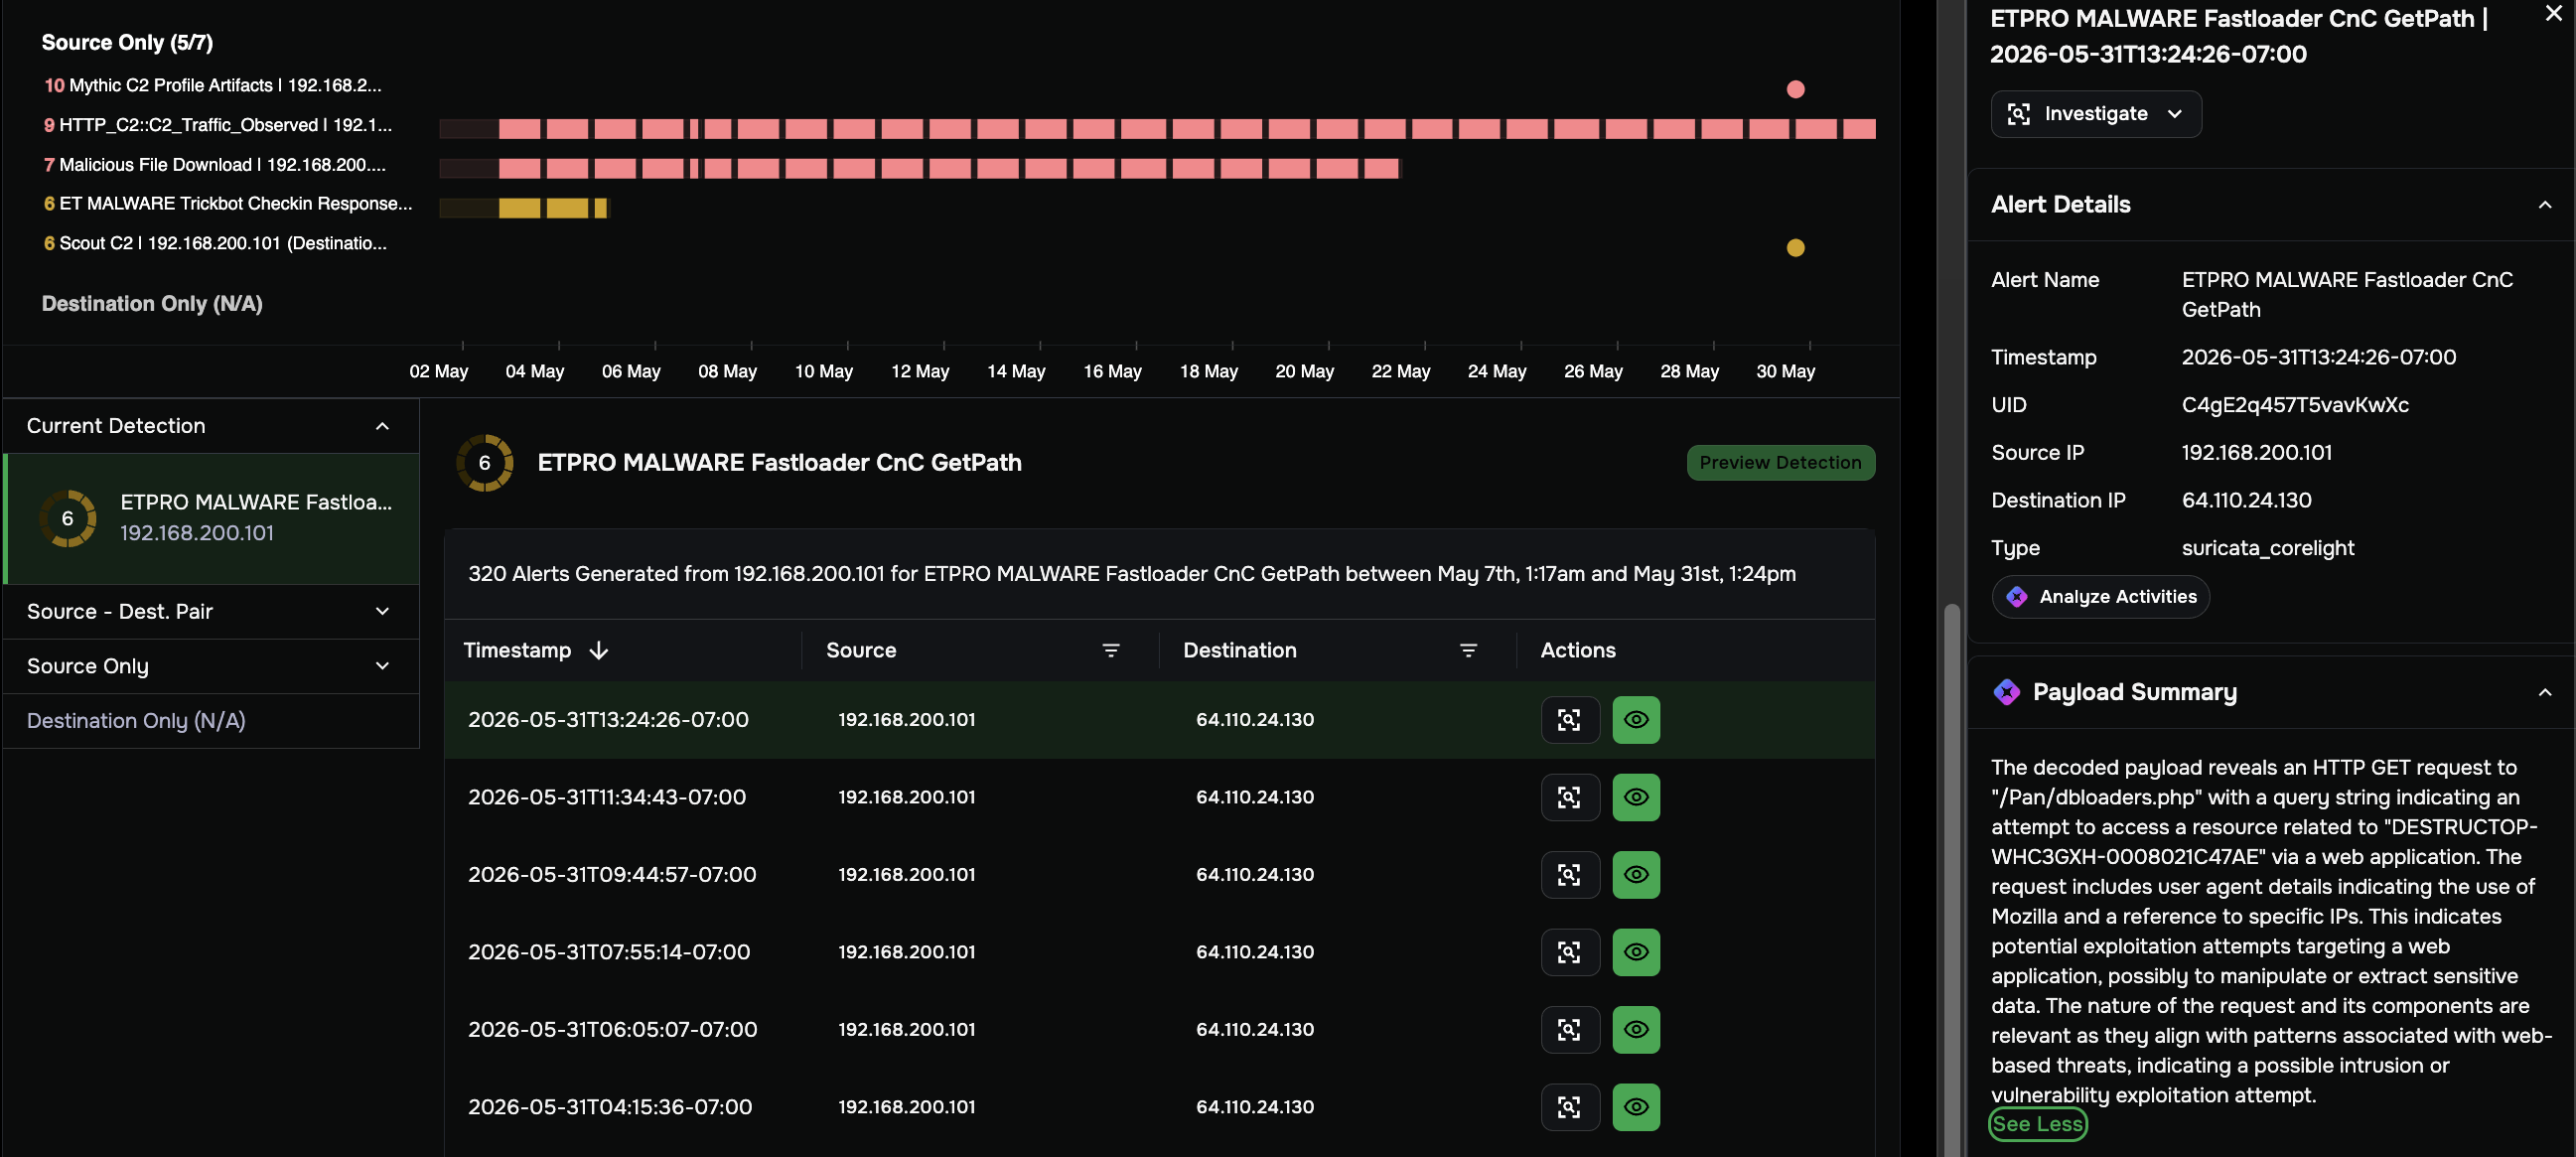
In the Alert Details flyout, click the Analyze Activities button (identified by a purple diamond icon) to open the Alert Connection Insights panel.
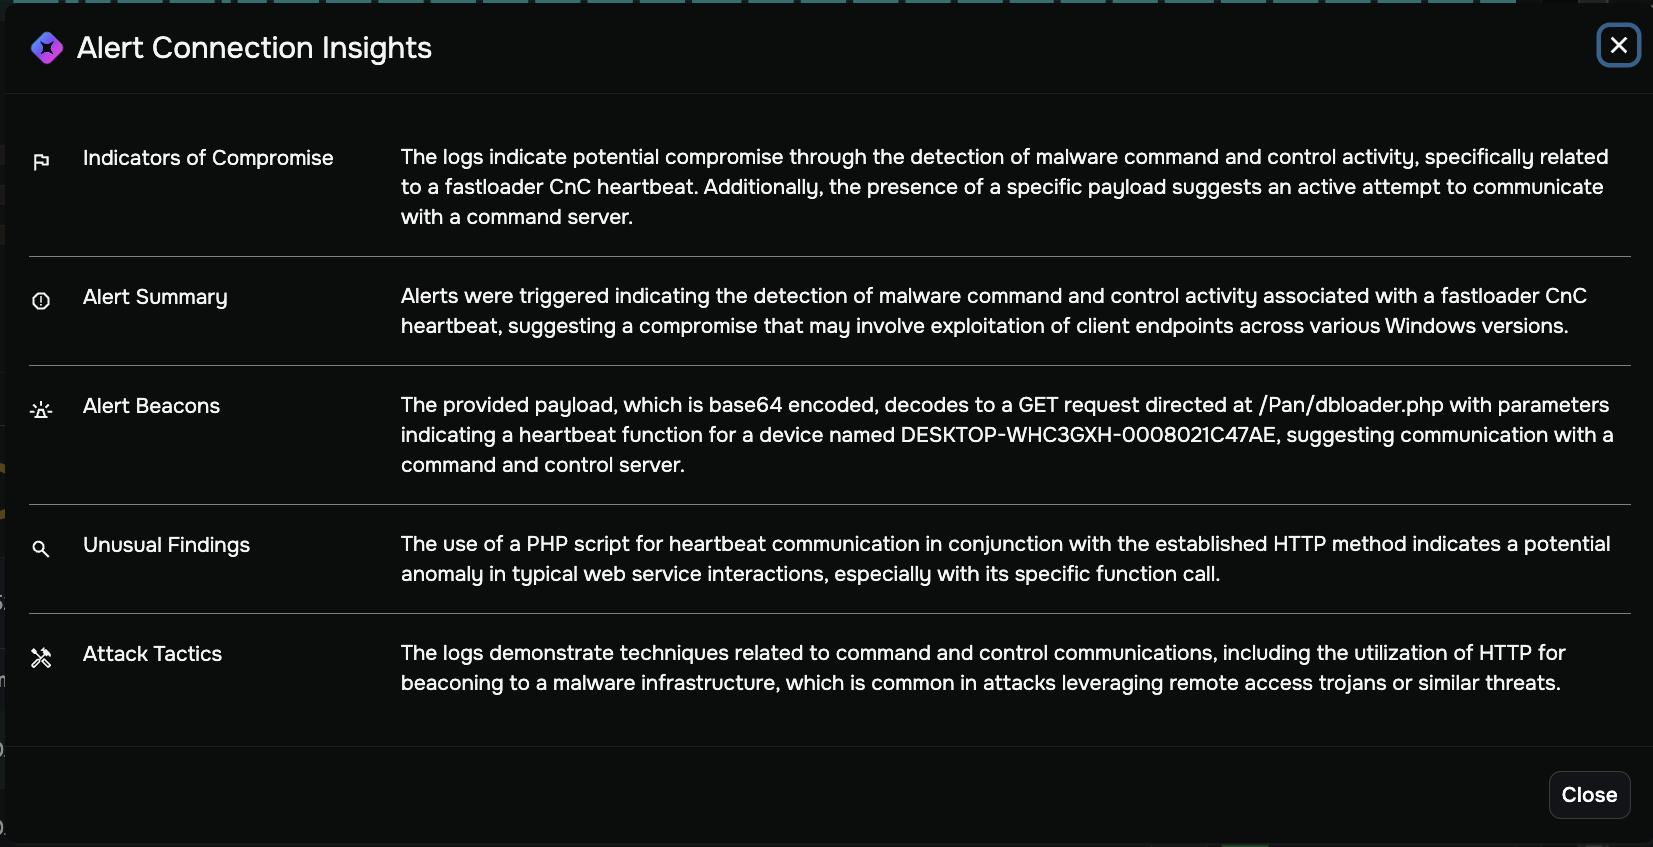
The Alert Connection Insights panel analyzes the raw network connection for this alert across five sections, giving you an AI-generated assessment without manually querying the logs.
Section |
What it shows |
|---|---|
Indicators of Compromise |
Evidence in the logs suggesting the connection is malicious, such as communication patterns, endpoint behavior, or known-bad infrastructure |
Alert Summary |
A plain-language description of what the alert detected and why it was triggered |
Alert Beacons |
Repetitive communication patterns in the logs that may indicate beaconing behavior, such as C2 check-ins at regular intervals |
Unusual Findings |
Behaviors that deviate from normal traffic patterns for this type of connection |
Attack Tactics |
MITRE ATT&CK-aligned tactics the AI identified based on the observed behavior |
Payload Summary
The Payload Summary section appears in the Alert Details panel between the Alert Details and Connection Details sections, identified by a purple diamond icon. It provides an AI-generated interpretation of the decoded packet payload for Suricata alerts that include payload data.
The summary describes what the payload reveals about the nature of the traffic, such as identifying a suspicious HTTP request, a command-and-control check-in pattern, or an exploit attempt. Click See More to expand the full summary. Click View Full Payload to open the complete raw payload string.
Note
Payload Summary only appears when your sensor is configured to capture payload data. For configuration details, see GPT integrations.
Review Investigation Findings
The Investigation Findings panel appears below the Detections Activity section. This panel shows the key conclusions the AI agent reached, each supported by specific evidence from network telemetry. Findings include both confirmed threats and conclusions where the evidence points to a non-malicious explanation — these conclusions are as actionable as confirmed threats: they tell you what you can confidently close or deprioritize.
What it shows:
Finding count: The total number of individual findings the agent identified (for example, “5”).
Finding cards: Each card summarizes a specific conclusion. Click the arrow (>) on any card to expand it and see the full details and supporting evidence for that finding.
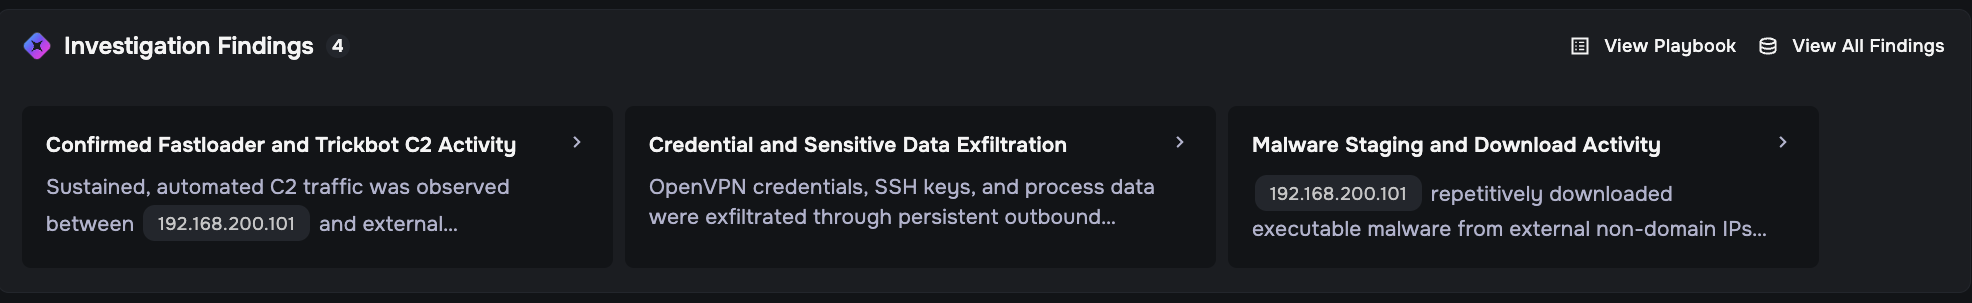
Two actions are available from this panel:
View Playbook: Opens the Playbook view showing the investigative steps the AI agent performed.
View All Findings: Opens the Key Findings view showing all findings with their full details and evidence.
View the Playbook
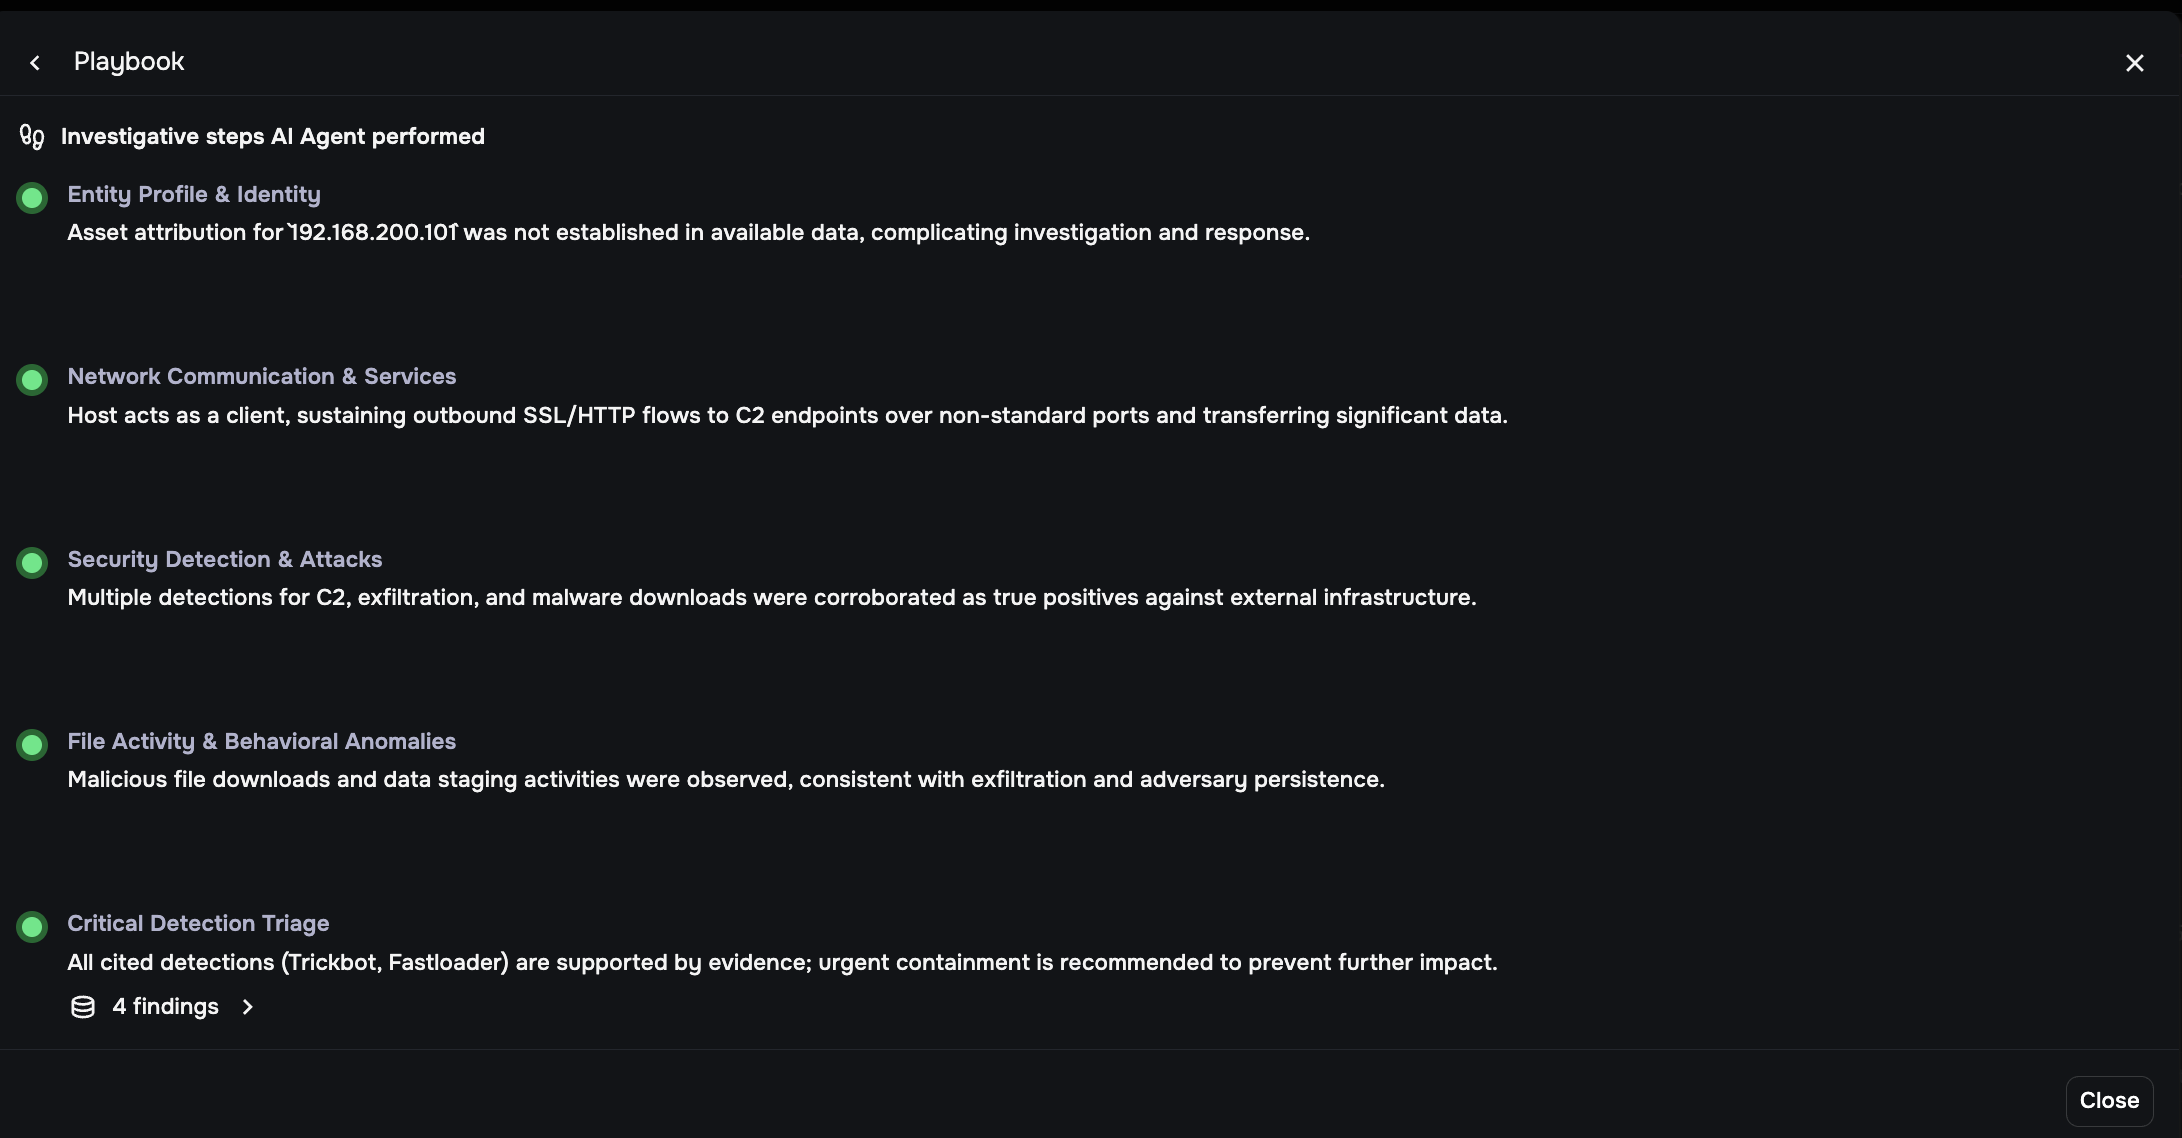
Click View Playbook to open the Playbook panel.
The Playbook shows the investigative steps the AI agent performed, organized as a structured series of checks. Each step has a green status dot confirming it was completed, a title, and a one-sentence summary of what the agent found at that step.
The standard playbook steps are:
Step |
What the agent checked |
|---|---|
Entity Profile & Identity |
Whether the entity is a known, attributed asset or an unidentified device |
Network Communication & Services |
Traffic patterns, protocols, and communication with external infrastructure |
Security Detection & Attacks |
Detection rules triggered and their significance as attack indicators |
File Activity & Behavioral Anomalies |
File transfers, downloads, and behaviors inconsistent with normal activity |
Critical Detection Triage |
Cross-correlation of all findings to produce a high-confidence attribution verdict |
The final step (Critical Detection Triage) shows a findings count link (for example, “5 findings >”). Click it to navigate to the Key Findings view for the full evidence list.
View Key Findings
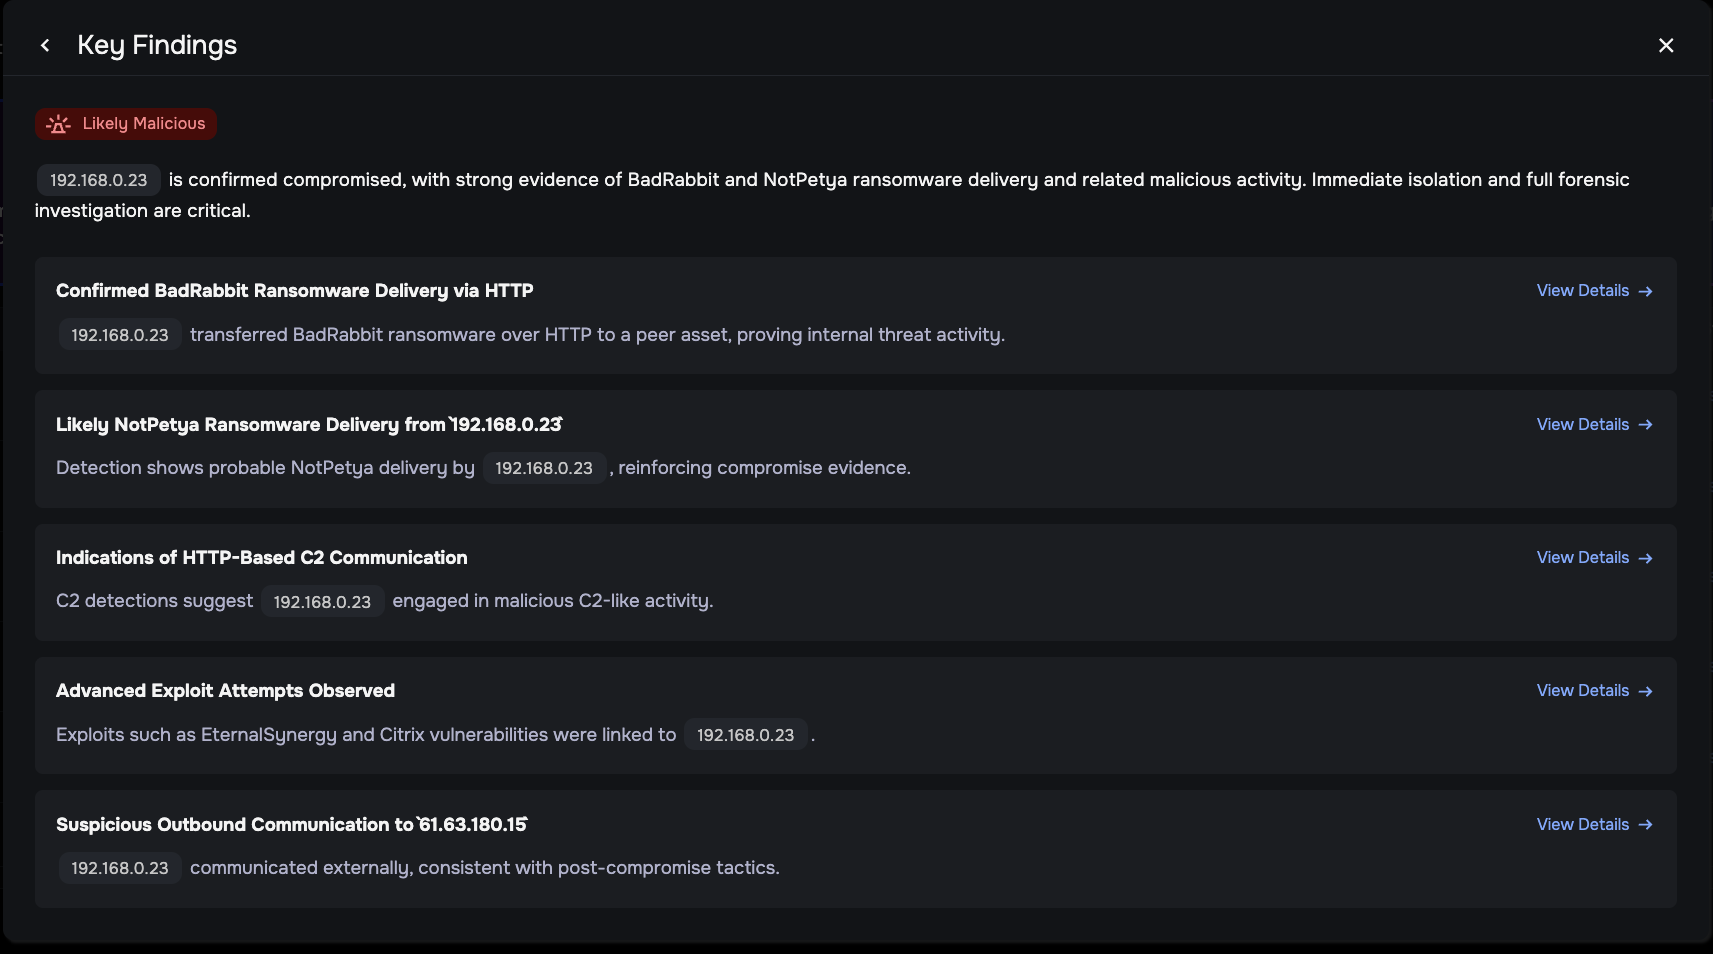
Click View All Findings from the Investigation Findings panel, or click the findings count link at the bottom of the Playbook, to open the Key Findings panel.
The Key Findings panel shows:
AI confidence verdict at the top, restating the overall verdict.
Summary statement: A one- or two-sentence overall conclusion citing the entity IP and the primary threats confirmed.
Individual findings: Each finding is a discrete piece of evidence the agent identified, with a title describing what was found and a sentence explaining the evidence.
View Details →: Click to open the evidence detail view, which shows the AI’s conclusion and the raw log record (Suricata or Zeek JSON) it used. Click View in LogSearch to open the full log context.
Review Recommended Responses
The Recommended Responses panel appears at the bottom of the Entity Overview when Agentic Triage is enabled.
This panel provides a set of specific, actionable response steps the AI agent recommends based on the findings. The recommendations reflect the AI confidence verdict and differ significantly depending on the verdict.
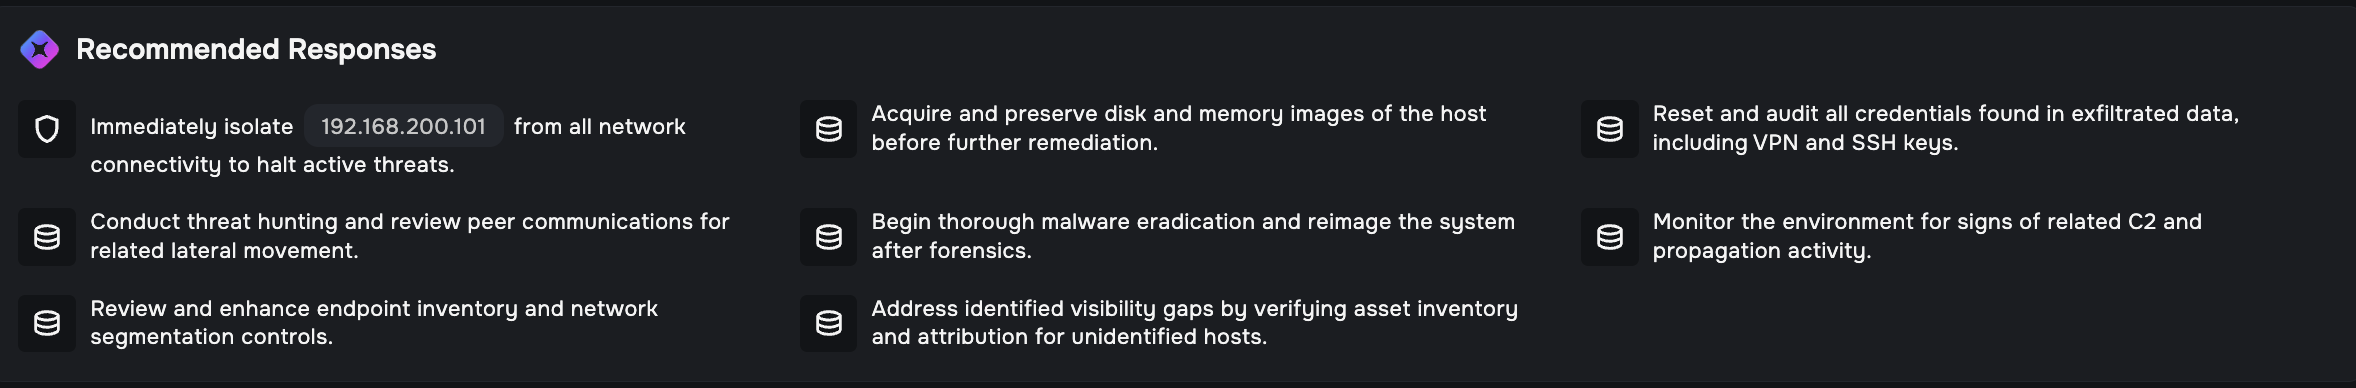
Needs Human Review
For Needs Human Review entities, the panel shows investigation and containment-focused steps. Examples include:
Review the Investigation Findings and validate the evidence before taking containment action.
If findings are confirmed, isolate the host to stop further command-and-control and exfiltration.
Collect full forensic disk and memory images from the host prior to starting system remediation.
Hunt for related indicators and C2 patterns elsewhere in the environment.
Preserve all relevant network, session, and exfiltration evidence for response and legal follow-up.
For Needs Human Review entities, the first recommendation includes an Immediately isolate [IP] action with a shield icon that lets you initiate isolation directly from this panel without navigating elsewhere.
Suspicious
For Suspicious entities, the panel shows steps focused on deeper investigation before taking containment action. Examples include:
Review the full Investigation Findings and validate each finding against the raw evidence before acting.
Monitor the entity closely for escalating activity.
Consider whether additional context (such as EDR data or asset ownership) would clarify the verdict.
Likely Benign
For Likely Benign entities, the panel shows steps focused on visibility improvements and documentation. Examples include:
No immediate containment or response actions are warranted based on available evidence.
Continue routine monitoring for recurrence of high-fidelity alerts; escalate if future evidence appears.
Address monitoring and enrichment gaps by implementing network/session, endpoint, and asset visibility for the entity.
Document this triage decision and the rationale, emphasizing persistent visibility constraints.
If the entity is a confirmed safe device (such as an authorized vulnerability scanner), use the Suppress Entity action from the three-dot menu (…) in the Entity Overview header to mute all future alerts for that device.
Undetermined
For Undetermined entities, the panel shows steps focused on filling the data gaps that prevented the AI from reaching a conclusion. Examples include:
Review the Investigation Findings to identify which evidence was missing or contradictory.
Check whether EDR data, asset ownership information, or additional network context is available for this entity.
If additional context resolves the ambiguity, re-evaluate the entity manually using the standard Entity Workflow.
Monitor the entity for new activity; if detections escalate or new high-fidelity alerts trigger, treat the entity as Suspicious and investigate accordingly.
Note
Recommended Responses are guidance, not automated actions (except for the Immediately isolate action available for Needs Human Review entities). You remain in control of all response decisions. To take action, use the Bulk Actions tools in the Detections Activity table or the EDR Details tab. See Investigate threats using the Entity Workflow for instructions.
Data privacy
Corelight follows a Privacy First framework to protect your network telemetry when Agentic Triage is enabled:
Zero data retention: Agreements with Corelight’s AI providers ensure that no submitted data or received responses are stored after processing.
No model training: Your private network data is never used to train, fine-tune, or improve underlying AI models.
Stateless processing: Data is used strictly for a one-time analysis and is deleted immediately once the report is complete.
Limitations
Federated tenants: Agentic Triage is not currently available in federated environments. If your organization uses a federated org tenant to manage child tenants, Agentic Triage is not supported at this time.
Not real-time: Agentic Triage runs on a fixed 24-hour schedule and is not user-configurable. There may be up to a 24-hour gap between a threat occurring and its automated analysis appearing in the dashboard.
Quick reference
Element |
How to access |
What it does |
|---|---|---|
AI Insights column |
Visible in the Highest-risk Entities table when AT is enabled |
Shows the AI confidence verdict for each analyzed entity |
AI Insights popover |
Click an AI confidence verdict in the table |
Shows a summary of the analysis and a link to open the full Entity Overview |
Analysis Summary panel |
Upper right of the Entity Overview |
Shows the AI confidence verdict, narrative findings summary, and feedback controls |
Detections AI summary line |
Below the Detections panel header |
One-sentence AI interpretation of the detections for this entity |
Analyze Activities button |
Inside the Alert Details section of the Alert Details panel |
Opens the Alert Connection Insights panel with AI-generated analysis of the network connection |
Alert Connection Insights |
Click Analyze Activities in the Alert Details panel |
AI analysis organized into Indicators of Compromise, Alert Summary, Alert Beacons, Unusual Findings, and Attack Tactics |
Payload Summary |
Alert Details panel, between Alert Details and Connection Details sections |
AI-generated interpretation of the decoded packet payload; includes See More and View Full Payload options |
Investigation Findings panel |
Below Detections Activity in the Entity Overview |
Shows key conclusions as finding cards; links to Playbook and Key Findings |
View Playbook |
Button in the Investigation Findings panel |
Shows the step-by-step investigative process the AI agent performed |
View All Findings |
Button in the Investigation Findings panel |
Opens the full Key Findings list with individual evidence items |
Key Findings |
Via View All Findings or the findings count link in the Playbook |
Shows all individual findings with View Details links to raw evidence |
View Details |
Link on each Key Finding |
Opens the finding title, description, and Associated Evidence (raw log JSON); includes a View in LogSearch button |
Recommended Responses panel |
Bottom of the Entity Overview |
Lists specific response actions recommended based on confirmed findings; includes an Immediately isolate action for Needs Human Review entities |
Thumbs up / Thumbs down |
Icons in the Analysis Summary panel |
Submit feedback after confirming or overturning the verdict |