Natural Language Query
Investigator’s Natural Language Query (NLQ) feature lets you search logs by asking questions in plain English. Investigator translates your question into a LogScale Query Language (LQL) query and runs it automatically.
With NLQ, you don’t need to know query syntax to investigate. If a detection or entity workflow raises a concern, you can go straight to Log Search and ask what happened in plain English instead of constructing a query manually. This makes log investigation accessible to analysts at every skill level and speeds up time-to-answer for experienced analysts who want a quick first look before refining a query.
NLQ is available in the Log Search view. See Log Search for an overview of Log Search.
Note
NLQ requires the GPT (Private data) integration to be enabled. If the NLQ input bar does not appear at the top of the Log Search page, contact your Corelight Investigator administrator. Administrators can enable this integration under System Settings > Integrations. See GPT integrations for details.
Use Natural Language Query
Click Log Search in the left navigation to get started. The NLQ input field appears at the top of the page with the placeholder text Ask about your network in natural language.

The NLQ input field with starter prompt cards.
Enter a question using one of the following methods:
Type your own question in the input field and click the submit button or press Enter. For example:
Show me total bytes transferred by internal host over the last 24 hours.Click one of the starter prompt cards below the input field to submit a suggested question automatically.
The Lux AI icon animates and the Analysis Process panel appears, showing reasoning steps in real time as Investigator interprets your question and builds the LQL query.
When processing completes, the generated LQL query appears in the Log Search query editor with inline comments explaining each part of the query. The query executes automatically and results appear in the results area below. The query is fully editable, so you can refine it and run it again.
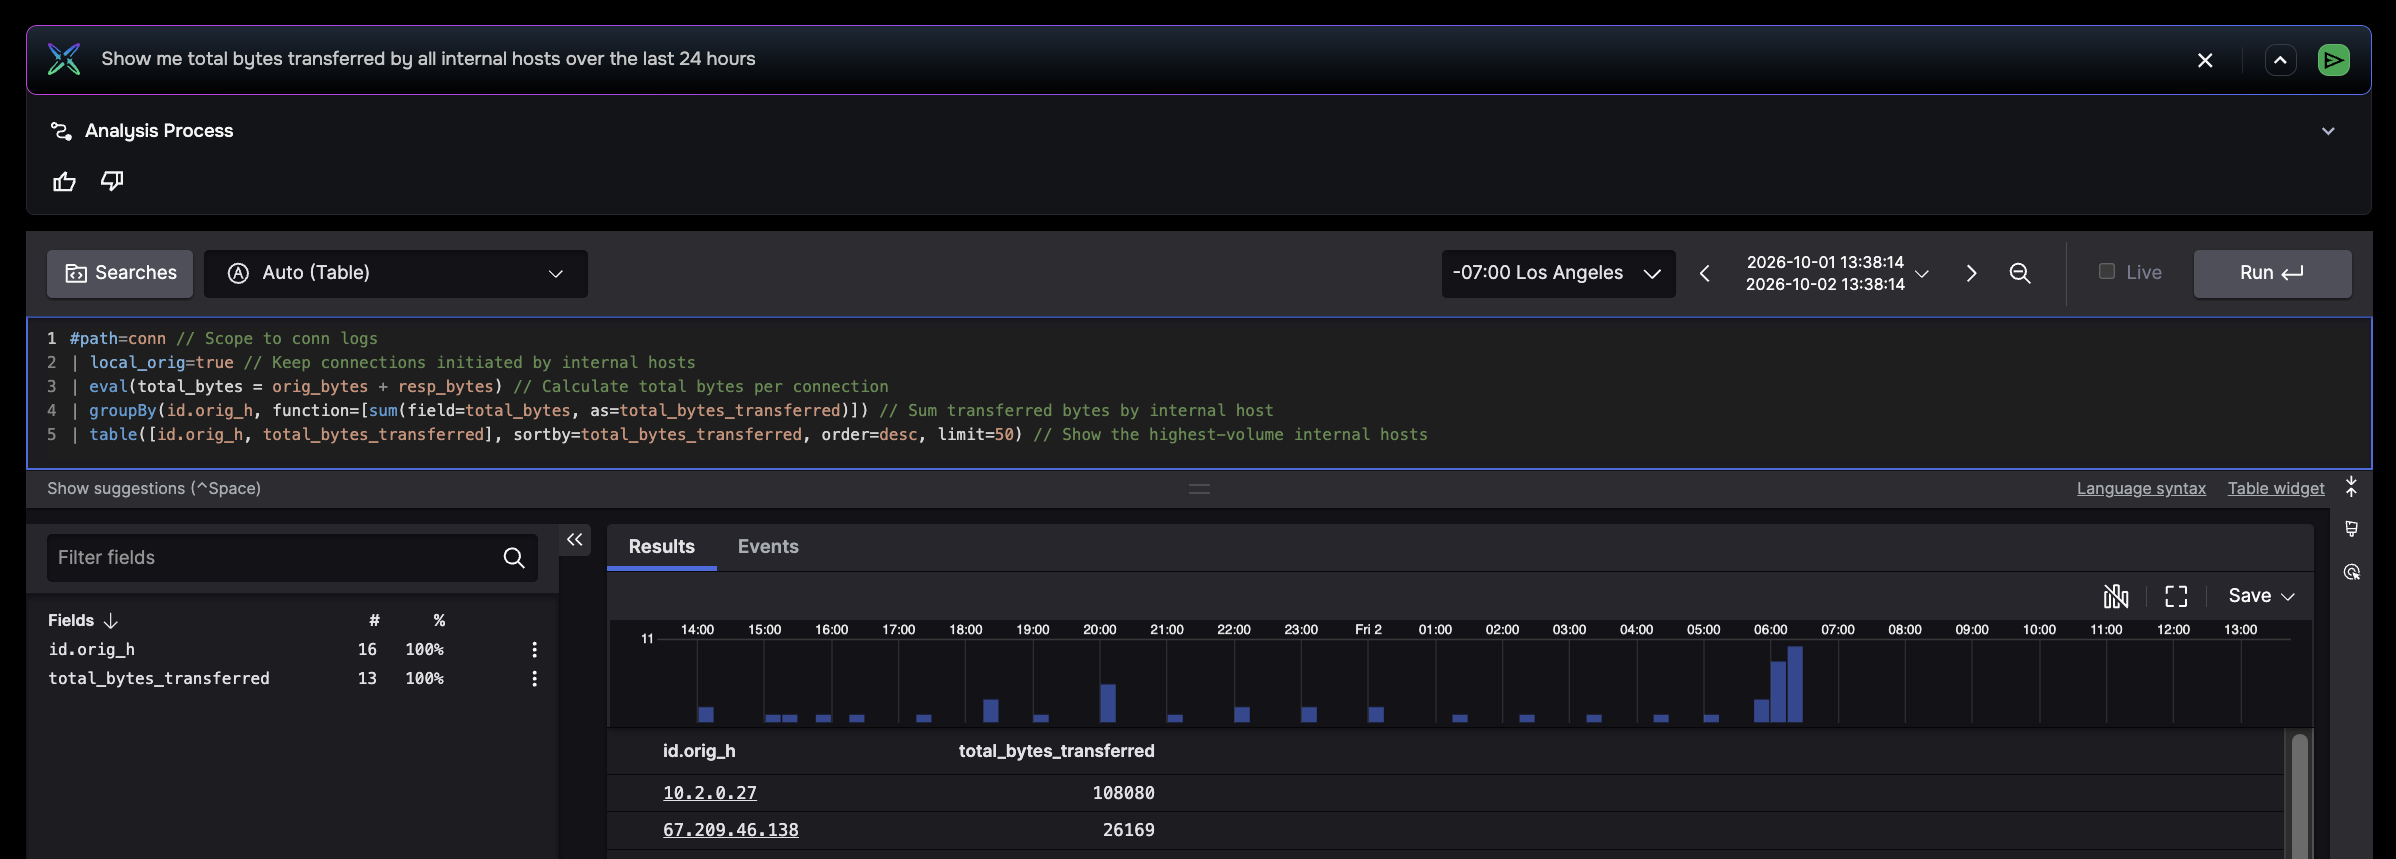
Completed query with inline comments in the editor and table results below.
NLQ generates a single query per question. It is not a conversational chatbot. To refine your results, rephrase your question and submit again. Click the X button to clear the current question before entering a new one.
Click the up arrow to collapse the NLQ input to a compact Ask in natural language bar. Click the down arrow or the bar itself to expand the full input field again.
Try a starter prompt
If you’re not sure what to ask, starter prompts appear below the input field when it’s empty. Click any prompt to populate the field and submit it automatically.
Category |
Example |
|---|---|
Network behavior & traffic |
Show me total bytes transferred by all internal hosts over the last 24 hours |
DNS hygiene & anomalies |
Find hosts doing DNS lookups to newly registered domains |
File transfers & exfiltration signals |
Chart file transfer size over time for internal hosts |
Network latency & performance |
Which connections have the highest round-trip latency in the last hour? |
Lateral movement |
Show me all SMB connections between internal hosts this week |
Review the Analysis Process
The Analysis Process panel shows the reasoning steps Investigator followed to build your query. After the query completes, you can collapse the panel by clicking it and expand it again to review the reasoning.
Steps you may see include:
Calling tools: the tools and data sources Investigator consulted to understand your question
Reasoning: how Investigator reviewed assumptions, query syntax options, and function requirements to construct the LQL query
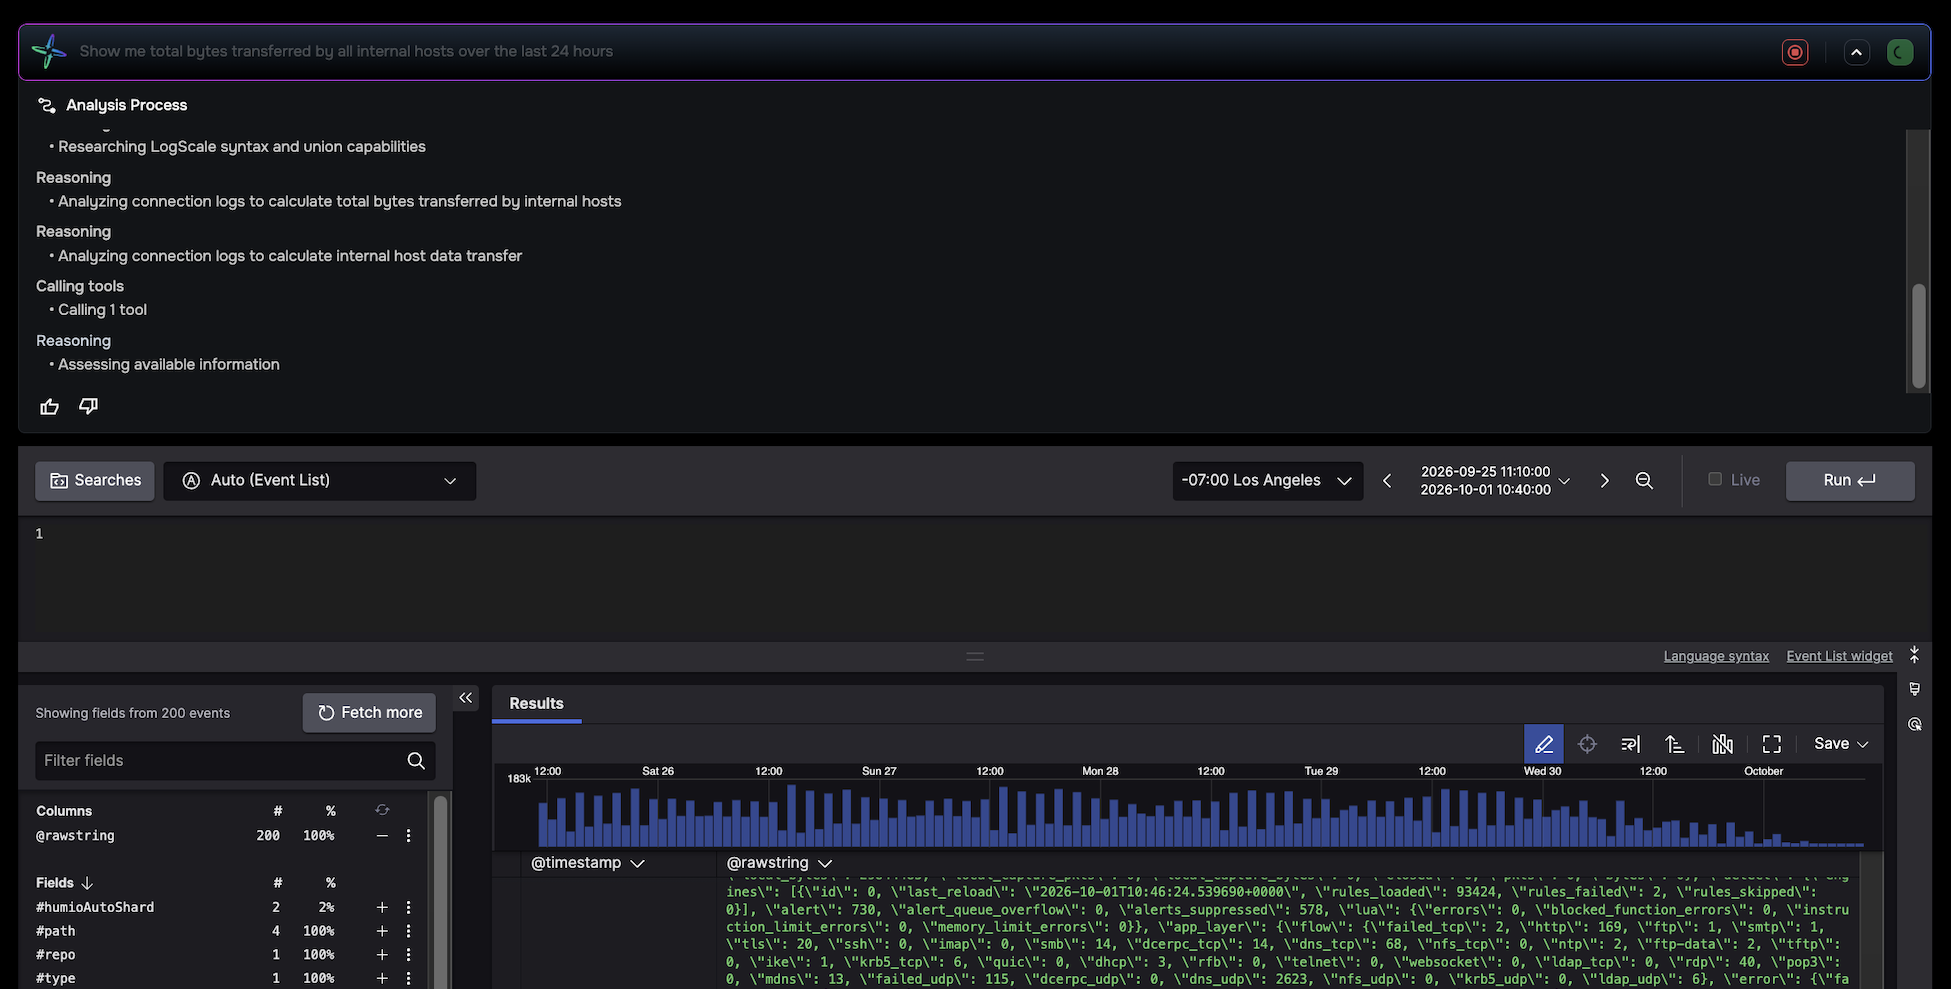
The Analysis Process panel showing live reasoning steps during query generation.
Use the Analysis Process to verify that Investigator interpreted your question correctly and to learn how natural language maps to LQL.
How NLQ handles time ranges
If your question includes a time reference (for example, in the last 24 hours or over the past week), Investigator infers the time range and applies it automatically. If no time range is specified, Investigator uses the time range currently set in the Log Search view. You can adjust the time range using the Log Search time range widget after the query runs.
What you can ask
NLQ is designed for questions about network activity and cybersecurity. Supported query types include:
Traffic analysis (bytes, connections, hosts)
DNS activity and anomalies
File transfers
Network latency and performance
Security events and threat indicators
These categories align with the starter prompts, but you can ask any question about your network data. Questions outside the scope of network security receive a guidance message asking you to rephrase.
Write better queries
Be specific. Include field names, entity types, or time ranges when you know them. Show DNS lookups to newly registered domains in the last 24 hours returns better results than show me DNS things.
Name the log type if you know it. For example: Show me conn log entries where the destination port is 443.
Include a time range. Queries with an explicit time range tend to produce more accurate LQL.
Rephrase if needed. If Investigator can’t generate a valid query, try rewording with a specific field, entity, or time reference.
Rate your results
After a query is generated, thumbs up and thumbs down icons appear below the Analysis Process panel. Click either icon to rate the result. Feedback helps improve query accuracy over time.
Troubleshoot errors
Message |
What it means |
What to do |
|---|---|---|
Limit search related to network security and cybersecurity |
The question is outside the supported scope. |
Rephrase with a network or security focus. |
Couldn’t generate a valid query |
Investigator was unable to produce valid LQL. An unvalidated query may appear in a dimmed code block that you can use manually. |
Rephrase using a specific field, entity, or time range, or review the unvalidated query if one is shown. |
Connection timed out |
The request timed out. |
Refresh the page and try again. |