Log Ingest
The Log Ingest dashboard shows how much data your sensors are sending to Investigator each day. Use it to monitor your daily ingest volume against your licensed allocation and to identify which log types are contributing the most data.
To access Log Ingest, click the Settings icon in the left navigation, then click Platform Monitoring. The page opens to the Log Ingest tab by default.
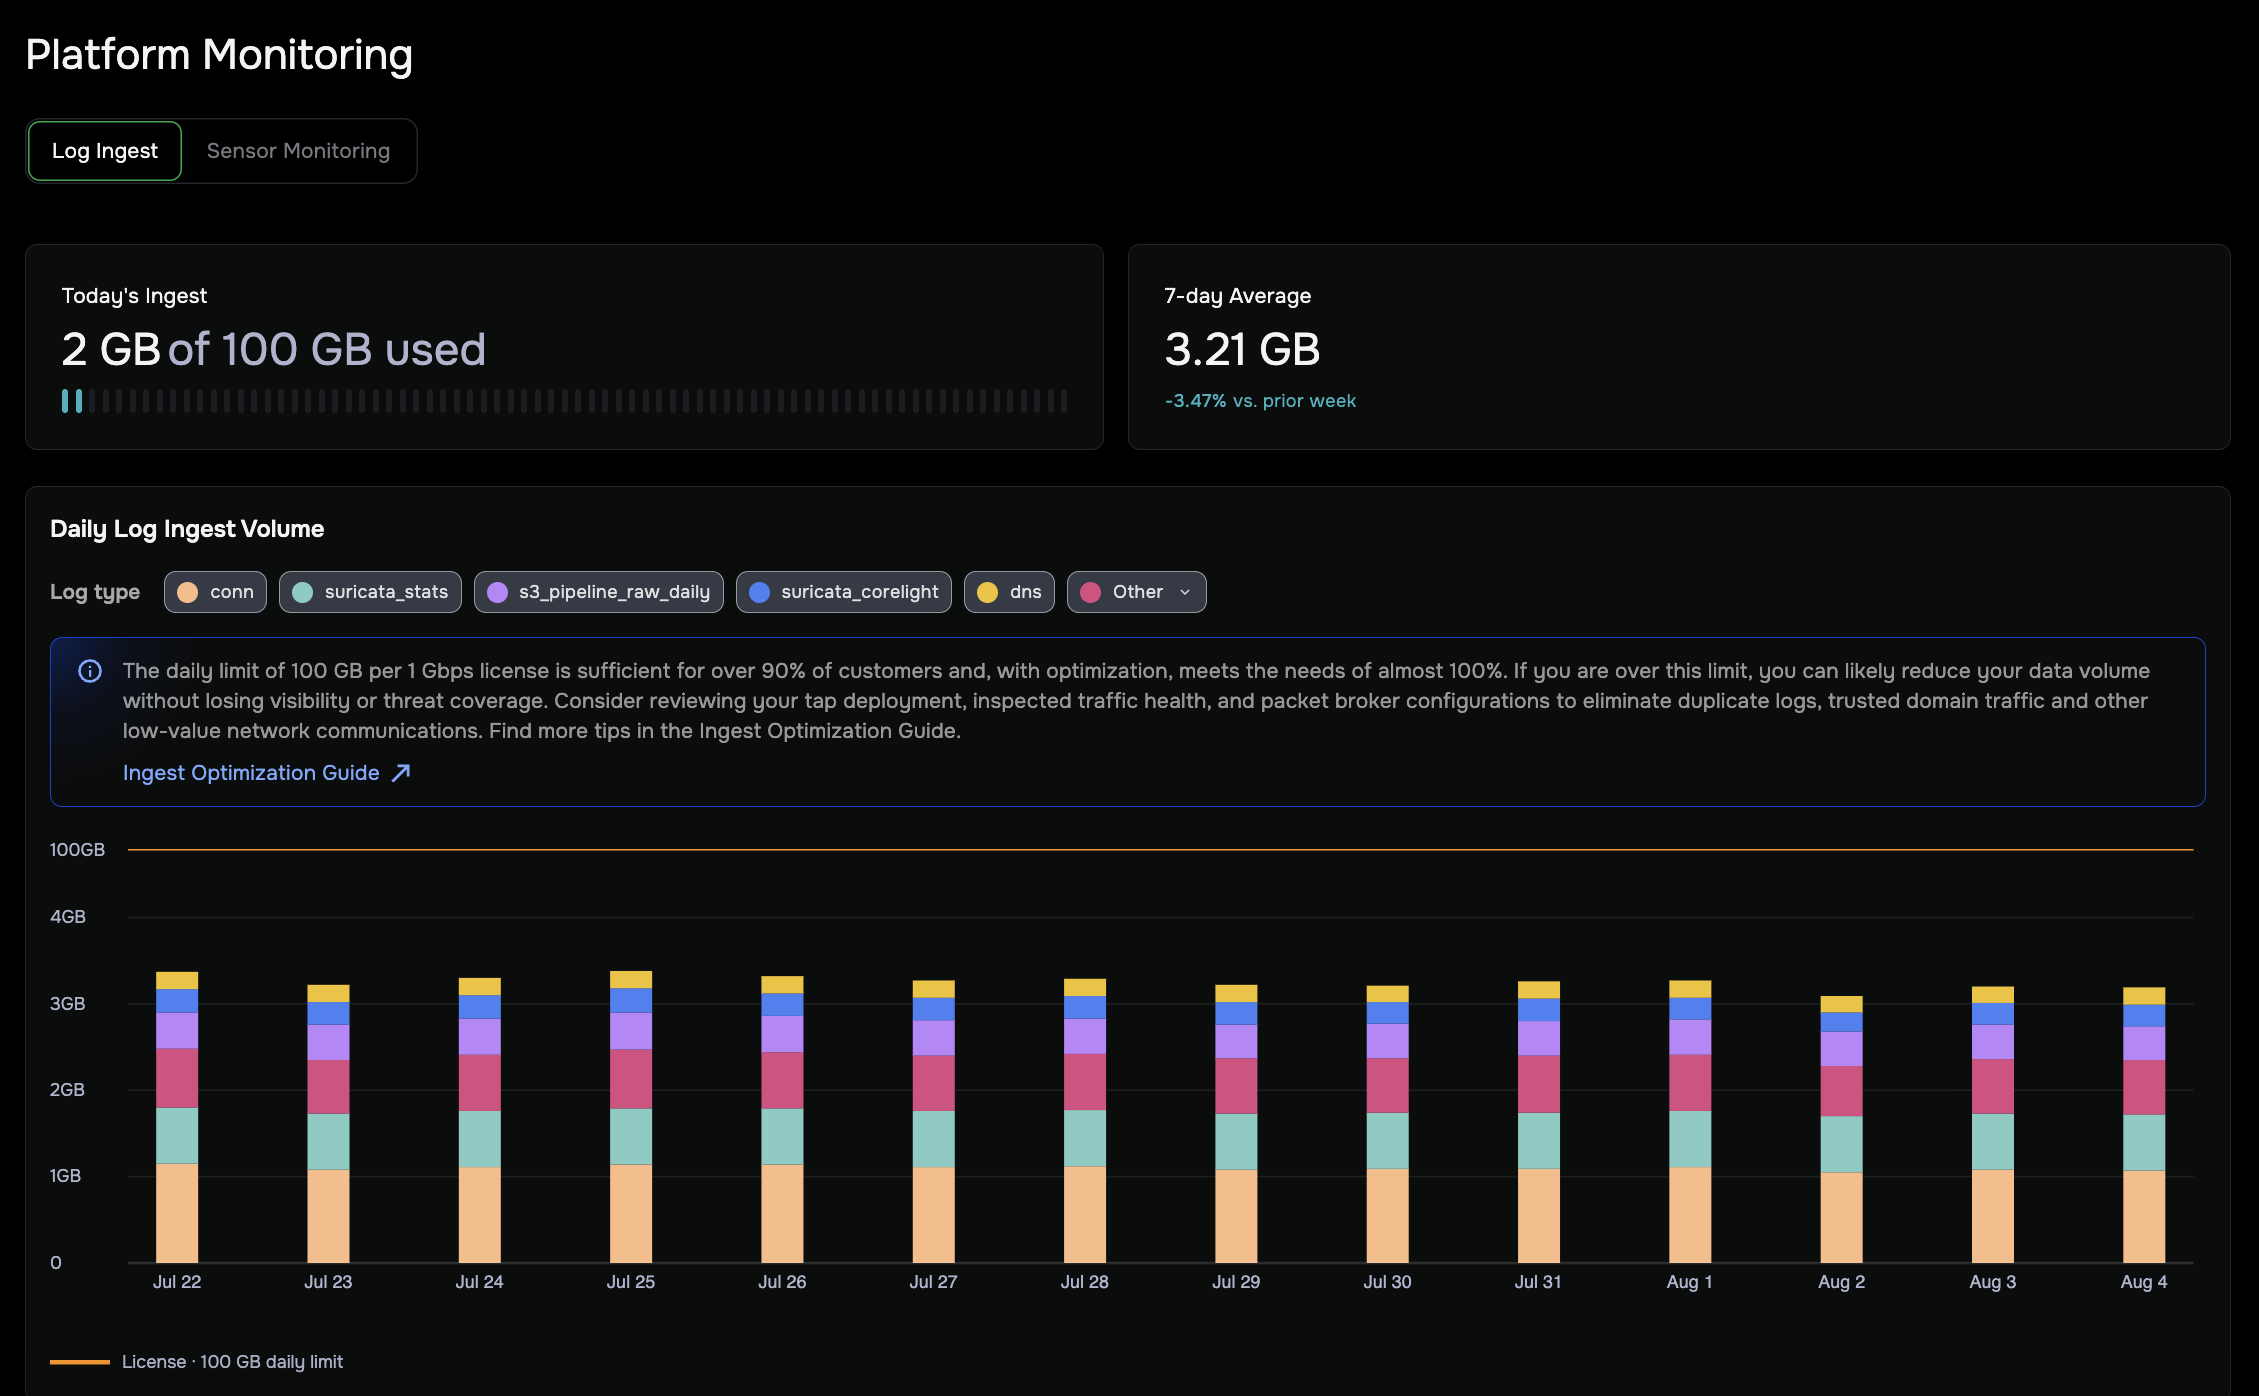
Summary metrics
The top of the page shows two summary cards:
Today’s Ingest — The total volume ingested so far today, shown as GB used against your daily allocation (for example, “2 GB of 100 GB used”).
The progress bar indicates where you are relative to your limit: teal below 90%, orange at 90–99%, and red above 100%.
Today’s Ingest reflects the current day’s data only, starting from midnight UTC, and is not included in the 7-day Average or the Daily Log Ingest Volume chart.
7-day Average — Your rolling seven-day average daily ingest volume, with a percentage showing the change compared to the prior week.
Your daily allocation is based on your licensed sensor throughput. For details, see Data ingestion.
Daily Log Ingest Volume chart
The chart shows your daily ingest volume as a stacked bar chart, with each bar representing one day and each color segment representing a log type. The chart displays up to 14 days of data.
An orange line across the chart marks your daily license limit. Below the chart, a static legend identifies this line as License · 100 GB daily limit (the value reflects your contracted daily capacity).
Log type filter
Above the chart, a row of colored chips shows the top five log types by volume for your environment, plus an Other group. Click a chip to toggle that log type on or off in the chart.
Click the Other dropdown to see the individual log types grouped within it. The list varies by environment and is scrollable when it contains many log types.
By default, all log types are selected and a Deselect All option appears at the top of the dropdown.
Click any log type to deselect it. When one or more are deselected, the dropdown shows Select All instead, and Select All and Reset buttons appear in the filter row.
Click Select All to reselect all log types, or click Reset to restore the default view.
Hovering over the chart
Hover over a colored bar segment to see the log type name and its volume for that day.
Hover over the empty space above the bars to see a full breakdown of all log types for that day, including each log type’s color, individual GB values, and the total. The list is scrollable when there are many log types.
Empty state
If no data has been ingested yet, the summary metrics show “0 GB used” against your daily allocation and a dash for the 7-day average. The chart area displays a “No data available yet” message.
Error state
If ingest data cannot be loaded, an “Ingest data failed to load” banner appears with a Refresh to try again link. The summary metric cards and chart each display an “Unable to load ingest data” message. Click Refresh to try again to retry.
Federated tenant view
If your organization uses a Federated Tenant structure, the Federated Tenant (Parent) account has access to Platform Monitoring with an aggregated view of log ingest across all child tenants.
When you open Log Ingest from a Federated Tenant (Parent), the page displays:
Organization-wide summary metrics — Aggregated Today’s Ingest and 7-day Average across all child tenants.
Child tenant ingest list — A table showing per-tenant ingest metrics for each child tenant. Use the search field to find a specific tenant, or sort by column to identify tenants with the highest or lowest ingest volume.
Drill-down — Click a child tenant to view its individual ingest details, including the Daily Log Ingest Volume chart and log type breakdown. Use the tenant dropdown to switch between child tenants without returning to the overview.
The view switches automatically based on tenant type: Federated Tenant (Parent) accounts see the aggregated overview, and child tenant accounts see the standard individual tenant view described above.